Rogers 2012 Annual Report Download - page 50
Download and view the complete annual report
Please find page 50 of the 2012 Rogers annual report below. You can navigate through the pages in the report by either clicking on the pages listed below, or by using the keyword search tool below to find specific information within the annual report.-
 1
1 -
2
-
3
-
4
-
5
-
6
-
7
-
8
-
9
-
10
-
11
-
12
-
13
-
14
-
15
-
16
-
17
-
18
-
19
-
20
-
21
-
22
-
23
-
24
-
25
-
26
-
27
-
28
-
29
-
30
-
31
-
32
-
33
-
34
-
35
-
36
-
37
-
38
-
39
-
 40
40 -
 41
41 -
 42
42 -
 43
43 -
 44
44 -
 45
45 -
 46
46 -
 47
47 -
 48
48 -
 49
49 -
 50
50 -
 51
51 -
 52
52 -
 53
53 -
 54
54 -
 55
55 -
 56
56 -
 57
57 -
 58
58 -
 59
59 -
 60
60 -
61
-
62
-
63
-
64
-
65
-
66
-
67
-
68
-
69
-
70
-
71
-
72
-
73
-
74
-
75
-
76
-
77
-
78
-
79
-
80
-
81
-
82
-
83
-
84
-
85
-
86
-
87
-
88
-
89
-
90
-
91
-
92
-
93
-
94
-
95
-
96
-
97
-
98
-
99
-
100
-
101
-
102
-
103
-
104
-
105
-
106
-
107
-
108
-
109
-
110
-
111
-
112
-
113
-
114
-
115
-
116
-
117
-
118
-
119
-
120
-
121
-
122
 |
 |

MANAGEMENT’S DISCUSSION AND ANALYSIS
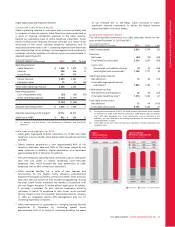
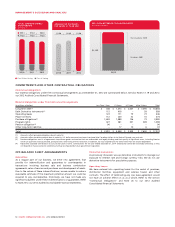
Finance Costs
The finance costs are as follows:
Years ended December 31,
(In millions of dollars) 2012 2011 % Chg
Interest on long-term debt $ (691) $ (668) 3
Loss on repayment of long-term debt –(99) n/m
Foreign exchange (loss) gain 9(6) n/m
Change in fair value of derivative
instruments (1) 14 n/m
Capitalized interest 28 29 (3)
Other (9) (8) 13
Total finance costs $ (664) $ (738) (10)
The $23 million increase in interest expense during 2012 reflects a
comparative increase in the principal amount of long-term debt
partially offset by the comparative decrease in the weighted average
interest rate on long-term debt compared to the previous year. The
change in principal and weighted-average interest rate primarily
reflects the refinancing activities completed in the second quarter of
2012. See the section below “Liquidity and Capital Resources”.
During 2011, we recorded a loss upon the early repayment of long-
term debt of $99 million, consisting of: (i) redemption premiums of
$76 million related to the redemption of two public debt issues; (ii) a
net loss on the termination of the related cross-currency interest rate
exchange agreements (“Debt Derivatives”) of $22 million; and (iii) a
write-off of deferred transaction costs of $2 million. This was partially
offset by a gain of $1 million relating to the non-cash write-down of
the fair value increment of long-term debt. (See the section below
“Debt Issuances and Redemptions”)
During 2012, the Canadian dollar strengthened by 2.2 cents versus the
U.S. dollar, resulting in a foreign exchange gain of $9 million,
primarily related to our US$350 million of Senior Notes due 2038 for
which the associated Debt Derivatives have not been designated as
hedges for accounting purposes. Much of this foreign exchange gain
is offset by the coincident change in the fair value of the associated
Debt Derivatives as discussed below. During 2011, the Canadian dollar
weakened by 2.2 cents versus the U.S. dollar, resulting in a foreign
exchange loss of $6 million, primarily related to our US$350 million of
Senior Notes due 2038 for which the associated Debt Derivatives have
not been designated as hedges for accounting purposes.
The expense for the change in the fair value of derivative instruments
during 2012 was primarily the result of (i) a non-cash gain on the
change in fair value of the Debt Derivatives hedging our US$350
million Senior Notes due 2038 that have not been designated as
hedges for accounting purposes combined with (ii) a non-cash loss
pertaining to an estimate of the relative hedge ineffectiveness of
Debt Derivatives that have been designated as hedges for accounting
purposes.
Other Income, Net
Other income of $15 million in 2012 was primarily associated with
investment income and expenses from certain investments, compared
to income of $1 million in 2011.
Share of the Income of Associates and Joint Ventures
During 2012, we acquired certain 2500 MHz spectrum from Inukshuk,
a 50% owned joint venture. As a result, we recorded a gain of $233
million, being the portion of the gain that related to the spectrum
licences sold to the non-related venturer. The remaining income of
$2 million was primarily due to our equity interest in various
investments, offset by the equity loss in MLSE.
Income Tax Expense
Our effective income tax rate for 2012 and 2011 was 26.4% and
25.5%, respectively. The 2012 effective income tax rate did not differ
from the 2012 statutory income tax rate of 26.4%. This is primarily
due to several offsetting adjustments to our 2012 tax expense. The
most significant favourable adjustments resulted from the realization
of capital gains, only 50% of which are taxable, and the utilization of
losses that were not previously recognized. These amounts were
offset by a tax charge relating to the revaluation of our net deferred
tax liability to reflect an increase in tax rates and adjustments in
respect of non-deductible expenses.
The 2011 effective income tax rate was less than the 2011 statutory
income tax rate of 28.0%, primarily due to income tax recoveries of
$28 million and $31 million relating to tax rate changes.
In 2012, we paid $380 million in income taxes, up from $99 million in
the previous year. With respect to cash income tax payments as
opposed to accounting income tax expense, we utilized substantially
all of our remaining non-capital income tax loss carryforwards in
2012. This combined with legislative changes to eliminate the deferral
of partnership income led to the sizeable increase last year in our cash
income tax payment, a trend we estimate will continue during 2013
as detailed in the section “2013 Financial Outlook and Targets”. While
both of these items impact the timing of cash taxes, neither is
expected to have a material impact on our income tax expense for
accounting purposes.
Income tax expense varies from the amounts that would be computed
by applying the statutory income tax rate to income before income
taxes for the following reasons:
Years ended December 31,
(In millions of dollars, except tax rate) 2012 2011
Statutory income tax rate 26.4% 28.0%
Income before income taxes $ 2,352 $ 2,135
Computed income tax expense $ 621 $ 598
Increase (decrease) in income taxes resulting
from:
Recognition of previously unrecognized
deferred tax assets (22) (12)
Non-taxable portion of capital gains (61) –
Revaluation of deferred tax balances due
to legislative changes 54 (28)
Tax rate differential on origination and
reversal of temporary differences –(31)
Impairment on goodwill and intangible
assets 11 –
Stock-based compensation 94
Other items 814
Income tax expense $ 620 $ 545
Effective income tax rate 26.4% 25.5%
46 ROGERS COMMUNICATIONS INC. 2012 ANNUAL REPORT