Rogers 2012 Annual Report Download - page 78
Download and view the complete annual report
Please find page 78 of the 2012 Rogers annual report below. You can navigate through the pages in the report by either clicking on the pages listed below, or by using the keyword search tool below to find specific information within the annual report.-
 1
1 -
2
-
3
-
4
-
5
-
6
-
7
-
8
-
9
-
10
-
11
-
12
-
13
-
14
-
15
-
16
-
17
-
18
-
19
-
20
-
21
-
22
-
23
-
24
-
25
-
26
-
27
-
28
-
29
-
30
-
31
-
32
-
33
-
34
-
35
-
36
-
37
-
38
-
39
-
40
-
41
-
42
-
43
-
44
-
45
-
46
-
47
-
48
-
49
-
50
-
51
-
52
-
53
-
54
-
55
-
56
-
57
-
58
-
59
-
60
-
61
-
62
-
63
-
64
-
65
-
66
-
67
-
 68
68 -
 69
69 -
 70
70 -
 71
71 -
 72
72 -
 73
73 -
 74
74 -
 75
75 -
 76
76 -
 77
77 -
 78
78 -
 79
79 -
 80
80 -
 81
81 -
 82
82 -
 83
83 -
 84
84 -
 85
85 -
 86
86 -
 87
87 -
 88
88 -
89
-
90
-
91
-
92
-
93
-
94
-
95
-
96
-
97
-
98
-
99
-
100
-
101
-
102
-
103
-
104
-
105
-
106
-
107
-
108
-
109
-
110
-
111
-
112
-
113
-
114
-
115
-
116
-
117
-
118
-
119
-
120
-
121
-
122
 |
 |

MANAGEMENT’S DISCUSSION AND ANALYSIS
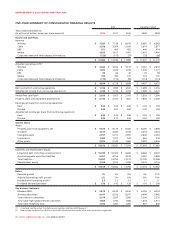
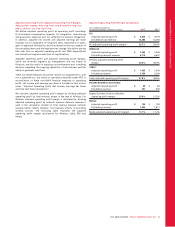
Average Revenue per User Calculations – Wireless
Years ended December 31,
(In millions of dollars, subscribers in thousands, except
ARPU figures) 2012 2011
Postpaid ARPU (monthly)
Postpaid (voice and data) revenue $ 6,402 $ 6,275
Divided by: average postpaid wireless
voice and data subscribers 7,698 7,443
Divided by: twelve months for the year 12 12
$ 69.30 $ 70.26
Prepaid ARPU (monthly)
Prepaid (voice and data) revenue $ 317 $ 326
Divided by: average prepaid subscribers 1,667 1,695
Divided by: twelve months for the year 12 12
$ 15.84 $ 16.02
Blended ARPU (monthly)
Voice and data revenue $ 6,719 $ 6,601
Divided by: average wireless voice and
data subscribers 9,365 9,138
Divided by: twelve months for the year 12 12
$ 59.79 $ 60.20
Operating Expenses
Operating expenses are segregated into two categories for assessing
business performance:
• Cost of equipment sales; and
• Other operating expenses.
In the Wireless and Cable industries in Canada, the demand for
services continues to grow, and the variable costs, such as
commissions paid for subscriber activations, as well as the fixed costs
of acquiring new subscribers, are significant. Fluctuations in the
number of activations of new subscribers from period-to-period and
the seasonal nature of both wireless and cable subscriber additions
result in fluctuations in sales- and marketing-related expenses and
accordingly, in the overall level of operating expenses. In our Media
business, sales and marketing related expenses may be significant to
promote publishing, radio and television properties, which in turn
attract advertisers, viewers, listeners and readers.
Capital Intensity
Capital intensity provides a comparative basis on the level of PP&E
additions within the industry. It is computed as the total additions to
PP&E divided by the total operating revenue. In case of Wireless,
capital intensity represents the total additions to PP&E divided by the
total network revenue.
Non-GAAP Measures
We have included certain non-GAAP financial measures that we
believe provide useful information to management and readers of
this MD&A in measuring our financial performance. These measures,
which include operating profit, operating profit margin, adjusted
operating profit, adjusted operating profit margin, adjusted net
income, adjusted basic and diluted earnings per share and free cash
flow, do not have a standardized meaning under GAAP and,
therefore, may not be comparable to similarly titled measures
presented by other publicly traded companies, nor should they be
construed as an alternative to other financial measures determined in
accordance with GAAP.
We believe that these non-GAAP financial measures may provide for a
more effective analysis of our operating performance. These measures
are also used by investors and lending institutions as an indicator of
our operating performance, our ability to incur and service debt, and
as a valuation metric. In addition, the items mentioned in the
preceding paragraph could potentially distort the analysis of trends
due to the fact that they are volatile and can vary widely from
company to company, thereby impairing comparability. The exclusion
of these items does not mean that they are unusual, infrequent or
non-recurring.
We use these non-GAAP measures internally to make strategic
decisions, forecast future results and evaluate our performance from
period to period and compare to forecasts on a consistent basis. We
believe that these measures present trends that are useful in
managing our business and in allowing investors and analysts to
assess the underlying changes in our business over time.
Operating Profit and Operating Profit Margin
We define operating profit as net income from continuing operations
before depreciation and amortization, income taxes and non-
operating items, which include finance costs (such as interest on long-
term debt, loss on repayment of long-term debt, foreign exchange
gains (losses), change in fair value of derivative instruments,
capitalized interest and amortization of deferred transaction costs),
impairment of assets, share of income in associates and joint ventures
and other income. Operating profit is a standard measure used in the
communications industry to assist in understanding and comparing
operating results and is often referred to by our peers and
competitors as EBITDA (earnings before interest, taxes, depreciation
and amortization) or OIBDA (operating income before depreciation
and amortization). We believe this is an important measure, as it
allows us to assess our ongoing businesses without the impact of
depreciation or amortization expenses as well as non-operating
factors. It is intended to indicate our ability to incur or service debt
and invest in PP&E and allows us to compare the Company to our
peers and competitors who may have different capital or
organizational structures. This measure is not a defined term under
IFRS.
74 ROGERS COMMUNICATIONS INC. 2012 ANNUAL REPORT