Rogers 2012 Annual Report Download - page 46
Download and view the complete annual report
Please find page 46 of the 2012 Rogers annual report below. You can navigate through the pages in the report by either clicking on the pages listed below, or by using the keyword search tool below to find specific information within the annual report.-
 1
1 -
2
-
3
-
4
-
5
-
6
-
7
-
8
-
9
-
10
-
11
-
12
-
13
-
14
-
15
-
16
-
17
-
18
-
19
-
20
-
21
-
22
-
23
-
24
-
25
-
26
-
27
-
28
-
29
-
30
-
31
-
32
-
33
-
34
-
35
-
 36
36 -
 37
37 -
 38
38 -
 39
39 -
 40
40 -
 41
41 -
 42
42 -
 43
43 -
 44
44 -
 45
45 -
 46
46 -
 47
47 -
 48
48 -
 49
49 -
 50
50 -
 51
51 -
 52
52 -
 53
53 -
 54
54 -
 55
55 -
 56
56 -
57
-
58
-
59
-
60
-
61
-
62
-
63
-
64
-
65
-
66
-
67
-
68
-
69
-
70
-
71
-
72
-
73
-
74
-
75
-
76
-
77
-
78
-
79
-
80
-
81
-
82
-
83
-
84
-
85
-
86
-
87
-
88
-
89
-
90
-
91
-
92
-
93
-
94
-
95
-
96
-
97
-
98
-
99
-
100
-
101
-
102
-
103
-
104
-
105
-
106
-
107
-
108
-
109
-
110
-
111
-
112
-
113
-
114
-
115
-
116
-
117
-
118
-
119
-
120
-
121
-
122
 |
 |

MANAGEMENT’S DISCUSSION AND ANALYSIS
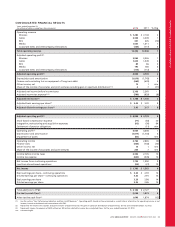
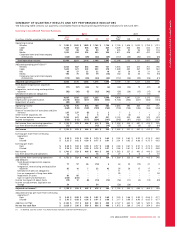
RBS Operating and Financial Results
Summarized RBS Financial Results
RBS’ total operating revenue declined due to the continued planned
exit of the legacy business. However, operating expenses were
reduced for the same reason, as well as a result of our strategic cost
management and productivity improvement initiatives; which
enabled RBS to deliver a year-over-year increase in adjusted operating
profit.
Years ended December 31,
(In millions of dollars, except margin) 2012 2011(1) % Chg
Operating revenue
Next generation $ 162 $ 128 27
Legacy 183 271 (32)
Service revenue 345 399 (14)
Equipment sales 66–
Total operating revenue 351 405 (13)
Operating expenses (262) (319) (18)
Adjusted operating profit(2) $89$86 3
Adjusted operating profit margin(2) 25.4% 21.2%
Additions to PP&E $61$55 11
(1) The operating results of Atria Networks LP are included in the RBS results of
operations from the date of its acquisition on January 4, 2011.
(2) As defined. See the section “Key Performance Indicators and Non-GAAP
Measures”.
RBS Operating Highlights for 2012
RBS continues to focus on achieving our strategic objectives as
discussed earlier and noted the following operating highlights for the
year ended December 31, 2012:
• Underlying the 13% year-over-year overall decline in RBS revenues
was a strong 27% growth of revenue associated with the on-net
and next generation IP-based services portions of the business. This
shift to higher margin on-net services enabled RBS to generate 3%
growth in adjusted operating profit while expanding adjusted
operating profit margins by 420 basis points year-over-year.
• RBS announced the availability of SIP Trunking, a new IP-based
voice solution for enterprises designed to complement its fibre-
based Internet and WAN connectivity services. By merging voice
services with a business data network, SIP Trunking solutions
dynamically allocate bandwidth as needed to support voice and/or
data needs depending upon capacity requirements during peak
hours and also provide a platform for next generation IP-based
video, mobile and productivity applications and services.
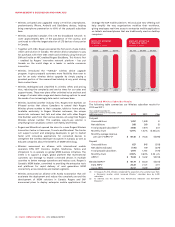
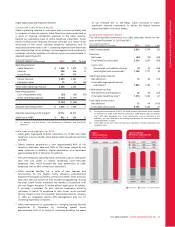
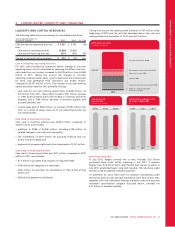
RBS Revenue
RBS’ revenues are generated from telephony, data networking and
access services used by enterprise and government customers, and the
sale of services on a wholesale basis to other telecommunications
carriers.
The year-over-year decrease in RBS’ revenue for the year ended
December 31, 2012 largely reflects the planned decline in certain
categories of the lower margin off-net legacy business, offset by
continued strong growth in the next generation IP and other on-net
services. RBS’ focus is primarily on IP-based services and increasingly
on leveraging higher margin on-net and near-net revenue
opportunities utilizing its own and Cable’s network facilities to
expand offerings to the medium and large-sized enterprise, public
sector and carrier markets. The lower margin off-net legacy business,
which includes long distance, local and certain legacy data services,
continues to decline as expected and was down 32% year-over-year.
In comparison, the higher margin next generation business was up
27% year-over-year.
Next Generation Legacy
271183
128162
20122011
(In millions of dollars)
RBS SERVICE
REVENUE MIX
RBS Operating Expenses
RBS’ operating expenses consist of: (i) telecom and data networking
equipment costs; and (ii) all other expenses incurred to operate the
business on a day-to-day basis, service existing customer relationships
and attract new subscribers.
Operating expenses decreased last year as a result of a planned
decrease in the legacy service-related costs (e.g., lower leased facility
costs), lower volumes and customer support-related spending levels,
and strategic initiatives to improve RBS’ cost structure and
productivity. RBS continues to implement permanent cost
management and efficiency improvement initiatives to control its
overall cost structure.
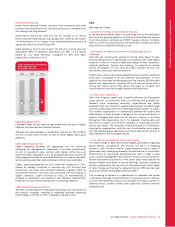
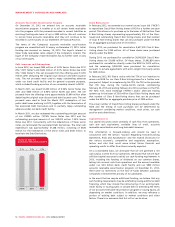
RBS Adjusted Operating Profit
The year-over-year growth in adjusted operating profit reflects RBS’
focus on growing its on-net next generation data revenue. This
strategic shift has more than offset the planned declines in the lower
margin legacy voice and data services. Cost reductions and efficiency
initiatives across various functions have also contributed to higher
operating profit margins.
(In millions of dollars)
RBS ADJUSTED OPERATING
PROFIT
$40 $86 $89
2010 2011 2012
42 ROGERS COMMUNICATIONS INC. 2012 ANNUAL REPORT