Rogers 2012 Annual Report Download - page 49
Download and view the complete annual report
Please find page 49 of the 2012 Rogers annual report below. You can navigate through the pages in the report by either clicking on the pages listed below, or by using the keyword search tool below to find specific information within the annual report.-
 1
1 -
2
-
3
-
4
-
5
-
6
-
7
-
8
-
9
-
10
-
11
-
12
-
13
-
14
-
15
-
16
-
17
-
18
-
19
-
20
-
21
-
22
-
23
-
24
-
25
-
26
-
27
-
28
-
29
-
30
-
31
-
32
-
33
-
34
-
35
-
36
-
37
-
38
-
 39
39 -
 40
40 -
 41
41 -
 42
42 -
 43
43 -
 44
44 -
 45
45 -
 46
46 -
 47
47 -
 48
48 -
 49
49 -
 50
50 -
 51
51 -
 52
52 -
 53
53 -
 54
54 -
 55
55 -
 56
56 -
 57
57 -
 58
58 -
 59
59 -
60
-
61
-
62
-
63
-
64
-
65
-
66
-
67
-
68
-
69
-
70
-
71
-
72
-
73
-
74
-
75
-
76
-
77
-
78
-
79
-
80
-
81
-
82
-
83
-
84
-
85
-
86
-
87
-
88
-
89
-
90
-
91
-
92
-
93
-
94
-
95
-
96
-
97
-
98
-
99
-
100
-
101
-
102
-
103
-
104
-
105
-
106
-
107
-
108
-
109
-
110
-
111
-
112
-
113
-
114
-
115
-
116
-
117
-
118
-
119
-
120
-
121
-
122
 |
 |

MANAGEMENT’S DISCUSSION AND ANALYSIS
> OutRank
We announced the exclusive availability of OutRank in Canada, a
new, best-in-class online marketing solution for small businesses
currently without a web presence. With OutRank, local businesses can
easily get a website, paid search marketing, search engine
optimization and a performance dashboard, all for an affordable
price. The service helps small businesses generate inbound phone calls
and e-mails by marketing them online where consumers are searching
for their services. OutRank was selected by Google to join the
AdWords Premier SMB Partner Program, the first Canadian-owned
and operated company in the program.
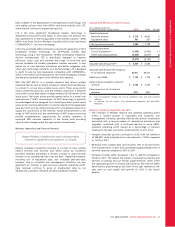
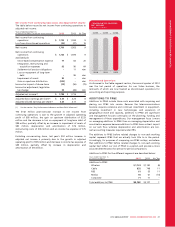
CONSOLIDATED ANALYSIS
We review the results of the following items below adjusted
operating profit on a consolidated basis.
Years ended December 31,
(In millions of dollars) 2012 2011 % Chg
Adjusted operating profit(1) $ 4,834 $ 4,739 2
Stock-based compensation expense (77) (64) 20
Integration, restructuring and
acquisition expenses (92) (56) 64
Settlement of pension obligations –(11) n/m
Operating profit(1) 4,665 4,608 1
Depreciation and amortization (1,819) (1,743) 4
Impairment of assets (80) – n/m
Operating income 2,766 2,865 (3)
Finance costs (664) (738) (10)
Other income, net 15 1 n/m
Share of the income of associates
and joint ventures 235 7 n/m
Income before income taxes 2,352 2,135 10
Income tax expense (620) (545) 14
Net income from continuing
operations 1,732 1,590 9
Loss from discontinued operations (32) (27) 19
Net income $ 1,700 $ 1,563 9
(1) As defined. See the section “Key Performance Indicators and Non-GAAP
Measures”.
Adjusted Operating Profit
As discussed above, the adjusted operating profit in Wireless, Cable,
RBS and Media increased for 2012 compared to 2011. For discussions
of the results of operations of each of these segments, refer to the
respective segment discussions.
Consolidated adjusted operating profit climbed to $4,834 million,
from $4,739 million in the prior year. These amounts for 2012 and
2011, respectively, exclude: (i) stock-based compensation expense of
$77 million and $64 million; (ii) integration, restructuring and
acquisition expenses of $92 million and $56 million; and
(iii) settlement of pension obligations of $nil and $11 million.
Stock-Based Compensation
The year-over-year increase in our stock-based compensation is
primarily attributable to the rise in the RCI.b stock price on the
Toronto Stock Exchange (“TSX”), which is used in determining the fair
value of our stock-based compensation liability at year-end.
Stock-based compensation expense increased to $77 million, from $64
million in 2011, mainly related to the stock price increase of $5.91
during 2012. The expense in a given period is generally determined
by the vested options and units valued at the current market price.
Approximately $47 million of the expense was related to the change
in market value of RCI stock compared to December 31, 2011.
At December 31, 2012, we had a liability of $195 million (2011 – $194
million) related to stock-based compensation recorded at its fair
value, including stock options, restricted share units and deferred
share units. During 2012, $76 million (2011 – $45 million) was paid to
holders of stock options, restricted share units and deferred share
units upon exercise. All of the stock option exercises were executed at
the election of the option holders through the exercise of the
optional share appreciation right (“SAR”) feature. We may use
derivative instruments from time to time to manage our exposure to
market-based fluctuations in our stock-based compensation expense.
Integration, Restructuring and Acquisition Expenses
During 2012, we incurred $92 million of integration, restructuring
and acquisition expenses associated with initiatives aimed at
improving our cost structure related to: (i) severance costs associated
with the targeted restructuring of our employee base ($89 million);
and (ii) acquisition transaction costs incurred and the integration costs
of acquired businesses ($3 million).
During 2011, we incurred $56 million of integration, restructuring
and acquisition expenses associated with initiatives to improve our
cost structure related to: (i) severance costs associated with the
targeted restructuring of our employee base ($42 million);
(ii) acquisition transaction costs incurred and the integration of
acquired businesses ($4 million); and (iii) the closure of certain retail
stores and lease exit costs ($10 million).
Settlement of Pension Obligations
During 2011, we incurred a non-cash loss from the settlement of
pension obligations of approximately $11 million resulting from a
lump-sum contribution of approximately $18 million to our pension
plans, following which the pension plans purchased approximately
$68 million of annuities from insurance companies for all employees
who had retired between January 1, 2009 and January 1, 2011. See
the section below “Pension Plans Purchase of Annuities”.
Depreciation and Amortization Expense
The year-over-year increase in depreciation and amortization reflects
an increase in depreciation on PP&E that is largely related to the
acceleration of depreciation on certain network transmission assets
and the timing of readiness of certain network and system initiatives,
including the launch of our LTE network in various municipalities. This
was mostly offset by a decrease in depreciation expense of $90 million
due to an increase in the estimated useful life made in July 2012 of
certain network and information technology assets.
Impairment of Assets
Late in 2012, we recorded an $80 million impairment charge in the
Media segment, consisting of $67 million in goodwill, $8 million in
broadcast licences and $5 million in program rights, using a
combination of value in use and fair value less costs to sell
methodologies with pre-tax discount rates of approximately 10%. The
recoverable amounts of the cash generating units declined in 2012
primarily due to the weakening of advertising revenue in certain
markets. There was no impairment of assets during 2011.
2012 ANNUAL REPORT ROGERS COMMUNICATIONS INC. 45