Rogers 2012 Annual Report Download - page 80
Download and view the complete annual report
Please find page 80 of the 2012 Rogers annual report below. You can navigate through the pages in the report by either clicking on the pages listed below, or by using the keyword search tool below to find specific information within the annual report.-
 1
1 -
2
-
3
-
4
-
5
-
6
-
7
-
8
-
9
-
10
-
11
-
12
-
13
-
14
-
15
-
16
-
17
-
18
-
19
-
20
-
21
-
22
-
23
-
24
-
25
-
26
-
27
-
28
-
29
-
30
-
31
-
32
-
33
-
34
-
35
-
36
-
37
-
38
-
39
-
40
-
41
-
42
-
43
-
44
-
45
-
46
-
47
-
48
-
49
-
50
-
51
-
52
-
53
-
54
-
55
-
56
-
57
-
58
-
59
-
60
-
61
-
62
-
63
-
64
-
65
-
66
-
67
-
68
-
69
-
 70
70 -
 71
71 -
 72
72 -
 73
73 -
 74
74 -
 75
75 -
 76
76 -
 77
77 -
 78
78 -
 79
79 -
 80
80 -
 81
81 -
 82
82 -
 83
83 -
 84
84 -
 85
85 -
 86
86 -
 87
87 -
 88
88 -
 89
89 -
 90
90 -
91
-
92
-
93
-
94
-
95
-
96
-
97
-
98
-
99
-
100
-
101
-
102
-
103
-
104
-
105
-
106
-
107
-
108
-
109
-
110
-
111
-
112
-
113
-
114
-
115
-
116
-
117
-
118
-
119
-
120
-
121
-
122
 |
 |

MANAGEMENT’S DISCUSSION AND ANALYSIS
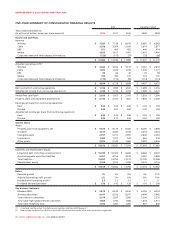
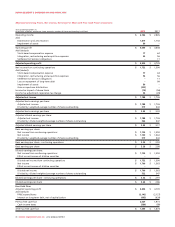
Adjusted Operating Profit, Net Income, Earnings Per Share and Free Cash Flow Calculations
Years ended December 31,
(In millions of dollars, except per share amounts; number of shares outstanding in millions) 2012 2011
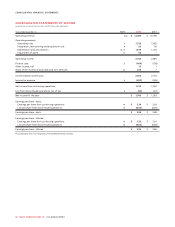
Operating income $ 2,766 $ 2,865
Add:
Depreciation and amortization 1,819 1,743
Impairment of assets 80 –
Operating profit $ 4,665 $ 4,608
Add (deduct):
Stock-based compensation expense 77 64
Integration, restructuring and acquisition expenses 92 56
Settlement of pension obligations –11
Adjusted operating profit $ 4,834 $ 4,739
Net income from continuing operations $ 1,732 $ 1,590
Add (deduct):
Stock-based compensation expense 77 64
Integration, restructuring and acquisition expenses 92 56
Settlement of pension obligations –11
Loss on repayment of long-term debt –99
Impairment of assets 80 –
Gain on spectrum distribution (233) –
Income tax impact of above items (14) (56)
Income tax adjustment, legislative tax change 54 (28)
Adjusted net income $ 1,788 $ 1,736
Adjusted basic earnings per share:
Adjusted net income $ 1,788 $ 1,736
Divided by: weighted average number of shares outstanding 519 543
Adjusted basic earnings per share $ 3.45 $ 3.20
Adjusted diluted earnings per share:
Adjusted net income $ 1,788 $ 1,736
Divided by: diluted weighted average number of shares outstanding 522 547
Adjusted diluted earnings per share $ 3.43 $ 3.17
Basic earnings per share:
Net income from continuing operations $ 1,732 $ 1,590
Net income $ 1,700 $ 1,563
Divided by: weighted average number of shares outstanding 519 543
Basic earnings per share - continuing operations $ 3.34 $ 2.93
Basic earnings per share $ 3.28 $ 2.88
Diluted earnings per share:
Net income from continuing operations $ 1,732 $ 1,590
Effect on net income of dilutive securities ––
Diluted net income from continuing operations $ 1,732 $ 1,590
Net income $ 1,700 $ 1,563
Effect on net income of dilutive securities ––
Diluted net income $ 1,700 $ 1,563
Divided by: diluted weighted average number of shares outstanding 522 547
Diluted earnings per share - continuing operations $ 3.32 $ 2.91
Diluted earnings per share $ 3.26 $ 2.86
Free Cash Flow
Adjusted operating profit $ 4,834 $ 4,739
Add (deduct):
PP&E expenditures (2,142) (2,127)
Interest on long-term debt, net of capitalization (663) (639)
Pre-tax free cash flow 2,029 1,973
Cash income taxes (380) (99)
After-tax free cash flow $ 1,649 $ 1,874
76 ROGERS COMMUNICATIONS INC. 2012 ANNUAL REPORT