Rogers 2012 Annual Report Download - page 115
Download and view the complete annual report
Please find page 115 of the 2012 Rogers annual report below. You can navigate through the pages in the report by either clicking on the pages listed below, or by using the keyword search tool below to find specific information within the annual report.-
 1
1 -
2
-
3
-
4
-
5
-
6
-
7
-
8
-
9
-
10
-
11
-
12
-
13
-
14
-
15
-
16
-
17
-
18
-
19
-
20
-
21
-
22
-
23
-
24
-
25
-
26
-
27
-
28
-
29
-
30
-
31
-
32
-
33
-
34
-
35
-
36
-
37
-
38
-
39
-
40
-
41
-
42
-
43
-
44
-
45
-
46
-
47
-
48
-
49
-
50
-
51
-
52
-
53
-
54
-
55
-
56
-
57
-
58
-
59
-
60
-
61
-
62
-
63
-
64
-
65
-
66
-
67
-
68
-
69
-
70
-
71
-
72
-
73
-
74
-
75
-
76
-
77
-
78
-
79
-
80
-
81
-
82
-
83
-
84
-
85
-
86
-
87
-
88
-
89
-
90
-
91
-
92
-
93
-
94
-
95
-
96
-
97
-
98
-
99
-
100
-
101
-
102
-
103
-
104
-
 105
105 -
 106
106 -
 107
107 -
 108
108 -
 109
109 -
 110
110 -
 111
111 -
 112
112 -
 113
113 -
 114
114 -
 115
115 -
 116
116 -
 117
117 -
 118
118 -
 119
119 -
 120
120 -
 121
121 -
 122
122
 |
 |

NOTES TO CONSOLIDATED FINANCIAL STATEMENTS
(ii) Performance RSUs:
During the year ended December 31, 2012, the Company
granted 172,779 performance-based RSUs (2011 – 189,571) to
certain key executives. The number of units that vest and will be
paid three years from the grant date will be within a range of
50% to 150% of the initial number granted based upon the
achievement of certain annual and cumulative three-year non-
market targets.
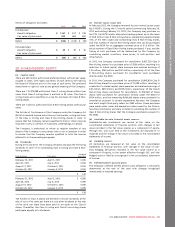
(iii) Summary of RSUs:
A summary of the RSU plans is as follows:
2012 2011
Number of units
Outstanding, beginning of year 1,988,955 1,616,370
Granted 893,784 928,544
Exercised (159,843) (416,146)
Forfeited (467,738) (139,813)
Outstanding, end of year 2,255,158 1,988,955
Unrecognized stock-based compensation expense at
December 31, 2012, related to these RSUs was $37 million
(2011 – $32 million) and will be recorded in the consolidated
statements of income over the next three years as the RSUs vest.
(c) Deferred share unit plan:
The DSU plan enables directors and certain key executives of the
Company to elect to receive certain types of remuneration in DSUs,
which are classified as a liability on the consolidated statements of
financial position.
During the year ended December 31, 2012, the Company granted
115,964 DSUs (2011 – 154,937). At December 31, 2012, 741,423 DSUs
(2011 – 751,903) were outstanding. There is no unrecognized
compensation related to DSUs, since these awards vest immediately
when granted.
(d) Employee share accumulation plan:
The employee share accumulation plan allows employees to
voluntarily participate in a share purchase plan. Under the terms of
the plan, employees of the Company can contribute a specified
percentage of their regular earnings through payroll deductions. The
designated administrator of the plan then purchases, on a monthly
basis, Class B Non-Voting shares of the Company on the open market
on behalf of the employee. At the end of each month, the Company
makes a contribution of 25% to 50% of the employee’s contribution
in the month, which is recorded as compensation expense. The
administrator then uses this amount to purchase additional shares of
the Company on behalf of the employee.
Compensation expense related to the employee share accumulation
plan amounted to $26 million for the year ended December 31, 2012
(2011 – $23 million) and is included in employee salaries and benefits.
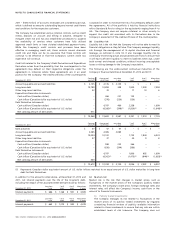
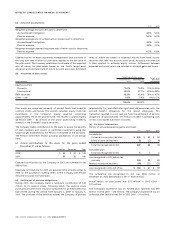
(e) Assumptions:
Significant management estimates are used to determine the fair
value of stock options, RSUs and DSUs. The weighted-average fair
value of stock options granted during the years ended December 31,
2012 and 2011, and the principal assumptions used in applying the
Black-Scholes model and trinomial option pricing models to
determine their fair value at grant date were as follows:
2012 2011
Weighted average fair value $ 7.51 $ 7.25
Risk-free interest rate 1.6% 2.8%
Dividend yield 4.0% 4.0%
Volatility of Class B Non-Voting shares 28.1% 29.0%
Weighted average expected life 5.4 years 5.4 years
For Trinomial option pricing model only:
Weighted average time to vest 2.4 years 2.4 years
Weighted average time to expiry 6.9 years 7.0 years
Employee exit rate 3.9% 3.6%
Suboptimal exercise factor 2.6 2.6
Lattice steps 50 50
Volatility has been estimated based on the actual trading statistics of
the Company’s Class B Non-Voting shares.
24. RELATED PARTY TRANSACTIONS:
(a) Controlling shareholder:
The ultimate controlling shareholder of the Company is the Rogers
Control Trust (“the Trust”) which holds voting control of the
Company. The beneficiaries of the Trust are members of the Rogers
family. The Rogers family is represented as Directors, Senior
Executives and Corporate Officers of the Company.
The Company entered into certain transactions with the ultimate
controlling shareholder of the Company and private Rogers’ family
holding companies controlled by the controlling shareholder of the
Company. These transactions, as summarized below, were recorded at
the amount agreed to by the related parties and are subject to the
terms and conditions of formal agreements approved by the Audit
Committee.
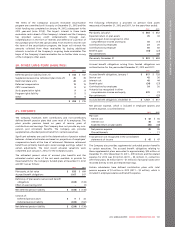
(b) Transactions with key management personnel:
Key management personnel include the Directors and the most Senior
Corporate Officers of the Company who are primarily responsible for
planning, directing and controlling the Company’s business activities.
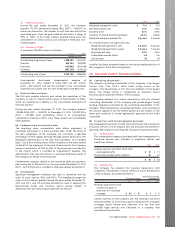
(i) Compensation:
The compensation expense associated with key management for
employee services was included in employee salaries and
benefits as follows:
2012 2011
Salaries, pension and other short-term
employee benefits $10 $11
Stock-based compensation expense 35 27
$45 $38
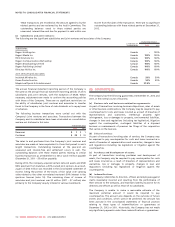
(ii) Transactions:
The Company has entered into business transactions with
companies, the partners or senior officers of which are Directors
of the Company, as summarized below:
Transaction value Balance outstanding,
December 31,
2012 2011 2012 2011
Printing, legal services and
commission paid on
premiums for insurance
coverage $43 $41 $1 $3
Certain directors of the Company are: the Chairman and Chief
Executive Officer of a firm that is paid commissions for insurance
coverage; Senior Partner and Chairman of a law firm that
provides legal services; and Chairman of a company that
provides printing services.
2012 ANNUAL REPORT ROGERS COMMUNICATIONS INC. 111