Rogers 2012 Annual Report Download - page 102
Download and view the complete annual report
Please find page 102 of the 2012 Rogers annual report below. You can navigate through the pages in the report by either clicking on the pages listed below, or by using the keyword search tool below to find specific information within the annual report.-
 1
1 -
2
-
3
-
4
-
5
-
6
-
7
-
8
-
9
-
10
-
11
-
12
-
13
-
14
-
15
-
16
-
17
-
18
-
19
-
20
-
21
-
22
-
23
-
24
-
25
-
26
-
27
-
28
-
29
-
30
-
31
-
32
-
33
-
34
-
35
-
36
-
37
-
38
-
39
-
40
-
41
-
42
-
43
-
44
-
45
-
46
-
47
-
48
-
49
-
50
-
51
-
52
-
53
-
54
-
55
-
56
-
57
-
58
-
59
-
60
-
61
-
62
-
63
-
64
-
65
-
66
-
67
-
68
-
69
-
70
-
71
-
72
-
73
-
74
-
75
-
76
-
77
-
78
-
79
-
80
-
81
-
82
-
83
-
84
-
85
-
86
-
87
-
88
-
89
-
90
-
91
-
 92
92 -
 93
93 -
 94
94 -
 95
95 -
 96
96 -
 97
97 -
 98
98 -
 99
99 -
 100
100 -
 101
101 -
 102
102 -
 103
103 -
 104
104 -
 105
105 -
 106
106 -
 107
107 -
 108
108 -
 109
109 -
 110
110 -
 111
111 -
 112
112 -
113
-
114
-
115
-
116
-
117
-
118
-
119
-
120
-
121
-
122
 |
 |

NOTES TO CONSOLIDATED FINANCIAL STATEMENTS
liabilities have been provided with respect to such temporary
differences where the Company is able to control the timing of the
reversal and such reversal is not probable in the foreseeable future.
Furthermore, reversal of such temporary differences, if it occurs, could
be implemented without any significant tax implications.
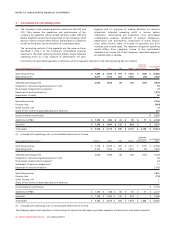
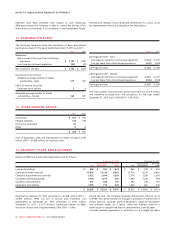
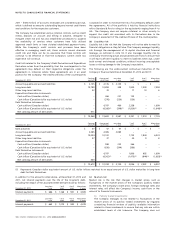
10. EARNINGS PER SHARE:
The following table sets forth the calculation of basic and diluted
earnings per share for the years ended December 31, 2012 and 2011:
2012 2011
Numerator:
Net income for the year from continuing
operations $ 1,732 $ 1,590
Loss from discontinued operations (32) (27)
Net income for the year $ 1,700 $ 1,563
Denominator (in millions):
Weighted average number of shares
outstanding – basic 519 543
Effect of dilutive securities:
Employee stock options 34
Weighted average number of shares
outstanding – diluted 522 547
2012 2011
Earnings per share – basic:
Earnings per share from continuing operations $ 3.34 $ 2.93
Loss per share from discontinued operations (0.06) (0.05)
Earnings per share $ 3.28 $ 2.88
Earnings per share – diluted:
Earnings per share from continuing operations $ 3.32 $ 2.91
Loss per share from discontinued operations (0.06) (0.05)
Earnings per share $ 3.26 $ 2.86
The total number of anti-dilutive options that were out of the money
and therefore excluded from the calculation for the year ended
December 31, 2012 was 17,240 (2011 – 1,570,760).
11. OTHER CURRENT ASSETS:
2012 2011
Inventories $ 293 $ 206
Prepaid expenses 126 108
Income tax receivable 39 –
Other 68
$ 464 $ 322
Cost of equipment sales and merchandise for resale includes $1,778
million (2011 – $1,625 million) of inventory costs.
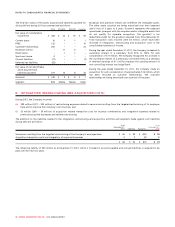
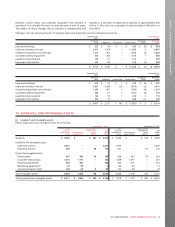
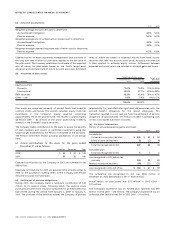
12. PROPERTY, PLANT AND EQUIPMENT
Details of PP&E and accumulated depreciation are as follows:
December 31, 2012 December 31, 2011
Cost Accumulated
depreciation Net book
value Cost Accumulated
depreciation Net book
value
Land and buildings $ 894 $ 260 $ 634 $ 865 $ 230 $ 635
Cable and wireless network 16,805 10,138 6,667 15,776 9,375 6,401
Computer equipment and software 3,972 2,644 1,328 3,574 2,358 1,216
Customer premise equipment 1,764 1,319 445 1,592 1,228 364
Leasehold improvements 407 248 159 392 239 153
Equipment and vehicles 1,055 712 343 1,006 661 345
$ 24,897 $ 15,321 $ 9,576 $ 23,205 $ 14,091 $ 9,114
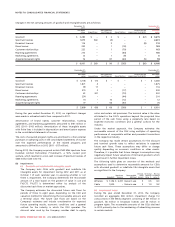
Depreciation expense for 2012 amounted to $1,678 million (2011 –
$1,595 million). PP&E not yet in service and, therefore, not
depreciated at December 31, 2012 amounted to $917 million
(December 31, 2011 – $1,371 million). Capitalized interest on PP&E
was at an interest rate of approximately 5.8% (2011 – 5.9%).
During the year, the Company reviewed depreciation rates for all of
its PP&E. This review resulted in changes in estimates of useful lives of
certain network, customer premise equipment, computer equipment
and software assets. As a result, cable and wireless network is
amortized on a straight-line basis at rates between 3 and 30 years,
customer premise equipment is amortized on a straight-line basis
98 ROGERS COMMUNICATIONS INC. 2012 ANNUAL REPORT