Rogers 2012 Annual Report Download - page 36
Download and view the complete annual report
Please find page 36 of the 2012 Rogers annual report below. You can navigate through the pages in the report by either clicking on the pages listed below, or by using the keyword search tool below to find specific information within the annual report.-
 1
1 -
2
-
3
-
4
-
5
-
6
-
7
-
8
-
9
-
10
-
11
-
12
-
13
-
14
-
15
-
16
-
17
-
18
-
19
-
20
-
21
-
22
-
23
-
24
-
25
-
 26
26 -
 27
27 -
 28
28 -
 29
29 -
 30
30 -
 31
31 -
 32
32 -
 33
33 -
 34
34 -
 35
35 -
 36
36 -
 37
37 -
 38
38 -
 39
39 -
 40
40 -
 41
41 -
 42
42 -
 43
43 -
 44
44 -
 45
45 -
 46
46 -
47
-
48
-
49
-
50
-
51
-
52
-
53
-
54
-
55
-
56
-
57
-
58
-
59
-
60
-
61
-
62
-
63
-
64
-
65
-
66
-
67
-
68
-
69
-
70
-
71
-
72
-
73
-
74
-
75
-
76
-
77
-
78
-
79
-
80
-
81
-
82
-
83
-
84
-
85
-
86
-
87
-
88
-
89
-
90
-
91
-
92
-
93
-
94
-
95
-
96
-
97
-
98
-
99
-
100
-
101
-
102
-
103
-
104
-
105
-
106
-
107
-
108
-
109
-
110
-
111
-
112
-
113
-
114
-
115
-
116
-
117
-
118
-
119
-
120
-
121
-
122
 |
 |

MANAGEMENT’S DISCUSSION AND ANALYSIS
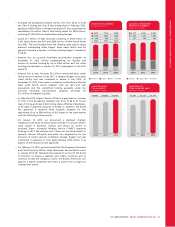
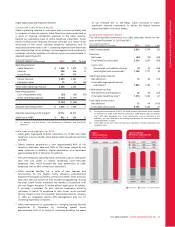
Pre-tax Free Cash Flow
Largely as a result of the adjusted operating profit growth and
additions to PP&E results discussed above, we delivered consolidated
pre-tax free cash flow of $2.0 billion. This was within our 2012
guidance range and represented a 3% increase from 2011. This free
cash flow generation supported the $1,153 million of cash that we
returned to shareholders in the form of $803 million of dividends and
share buybacks totalling $350 million.
Cash Income Taxes
Cash income taxes were below the low end of our targeted 2012
range due to income tax planning and containment strategies. These
savings further contributed to consolidated free cash flow generation,
which totalled $1.6 billion on an after-tax basis.
2013 FINANCIAL OUTLOOK AND TARGETS
The following table outlines guidance ranges and assumptions for
selected 2013 financial metrics, which takes into consideration our
strategic priorities and current outlook. This information is forward-
looking and should be read in conjunction with the section “Caution
Regarding Forward-Looking Statements, Risks and Assumptions” and
the related disclosures; various economic, competitive and regulatory
assumptions, factors and risks may cause actual future financial and
operating results to differ from those currently expected.
We provide annual guidance ranges on a consolidated full year basis
and are consistent with annual full year board-approved plans. In our
fourth quarter earnings release at the start of each year, we also
provide full year supplemental forecast details at the operating
segment level for both revenue and adjusted operating profit that is
not part of our formal 2013 guidance and is provided for information
purposes only. Any updates to our full year financial guidance over
the course of the year would be made only to the consolidated level
guidance ranges that appear below.
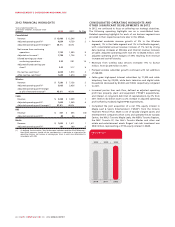
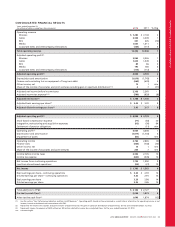
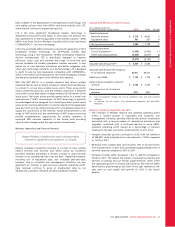
Full Year 2013 Guidance
(In millions of dollars) 2012
Actual 2013
Guidance
Consolidated Guidance
Adjusted operating profit(1)(4) $ 4,834 $ 4,865 to $ 5,050
Additions to PP&E(2) 2,142 2,150 to 2,250
Pre-tax free cash flow(3)(4) 2,029 2,030 to 2,090
Cash income taxes 380 650 to 700
(1) As defined. See the section “Key Performance Indicators and Non-GAAP
Measures”.
(2) Includes additions to Wireless, Cable, Media, RBS, and Corporate PP&E
expenditures.
(3) Pre-tax free cash flow is defined as adjusted operating profit less PP&E
expenditures and interest on long-term debt (net of capitalization), and is not a
defined term under IFRS.
(4) Assumes Mountain Cable and theScore close mid-year 2013.
As discussed in the section “Our Strategy”, we plan to meet our 2013
financial targets by executing the following six long-term strategic
objectives:
1. Deliver differentiated end-to-end customer experiences
Focus on evolving our cross-device integration to enable
seamless, reliable and easy-to-use customer experiences anytime,
anyplace and anywhere. Deliver a differentiated range of
devices and device-related services. Enable greater integration of
our media assets across screen types.
2. Maintain industry-leading networks
Expand our LTE network to a wider proportion of the Canadian
population. Continue to increase broadband Internet speeds and
migrate cable Internet subscribers to DOCSIS 3.0 technology.
Further enhance our TV platform with next generation features
and functionality.
3. Expand our services reach
Expand the reach of our networks and services through new
construction, by more widely deploying products such as the
Rogers One Number service, and by expanding the reach of key
media brands through our digital platforms.
4. Strengthen the customer experience
Widely deploy Rogers’ new retail store design and service
approach across our network of Rogers Plus stores. Continue to
improve our Rogers Concierge service and simplify our product
offerings.
5. Improve productivity and cost structure
Continue to focus on cost optimization initiatives aimed at
further improving organizational efficiency, by reducing
complexity, focusing on fewer, more impactful projects,
managing expenses and working closely with key suppliers.
6. Drive future growth opportunities
Continue to grow and nurture promising new growth areas of
our business, including M2M communications, mobile commerce,
local and digital media services, home automation and business
communications services.
3. FINANCIAL AND OPERATING RESULTS
For important accounting policies and estimates as they relate to the following discussion of our operating and financial results, please refer to
the sections in this MD&A “Accounting Policies”, “Critical Accounting Estimates” and “New Accounting Standards”, as well as the Notes to our
2012 Audited Consolidated Financial Statements.
We measure the success of our strategies in the ongoing management of our business using a number of key performance indicators, as
outlined in the section “Key Performance Indicators and Non-GAAP Measures”. Many of these key performance indicators are not
measurements in accordance with IFRS and should not be considered as alternative measures to net income or any other financial measure of
performance under IFRS. The non-GAAP measures presented in this MD&A include, among other measures, operating profit, free cash flow and
the “adjusted” amounts. We believe that the non-GAAP financial measures (which generally exclude: (i) stock-based compensation expense
(recovery); (ii) integration, restructuring and acquisition expenses; (iii) settlement of pension obligations; and (iv) in respect of net income and
earnings per share, loss on repayment of long-term debt, impairment of assets, gain on spectrum distribution and the related income tax
impacts of the preceding items and legislative change) provide for a more effective and actionable analysis of our operating performance.
32 ROGERS COMMUNICATIONS INC. 2012 ANNUAL REPORT