Rogers 2012 Annual Report Download - page 43
Download and view the complete annual report
Please find page 43 of the 2012 Rogers annual report below. You can navigate through the pages in the report by either clicking on the pages listed below, or by using the keyword search tool below to find specific information within the annual report.-
 1
1 -
2
-
3
-
4
-
5
-
6
-
7
-
8
-
9
-
10
-
11
-
12
-
13
-
14
-
15
-
16
-
17
-
18
-
19
-
20
-
21
-
22
-
23
-
24
-
25
-
26
-
27
-
28
-
29
-
30
-
31
-
32
-
 33
33 -
 34
34 -
 35
35 -
 36
36 -
 37
37 -
 38
38 -
 39
39 -
 40
40 -
 41
41 -
 42
42 -
 43
43 -
 44
44 -
 45
45 -
 46
46 -
 47
47 -
 48
48 -
 49
49 -
 50
50 -
 51
51 -
 52
52 -
 53
53 -
54
-
55
-
56
-
57
-
58
-
59
-
60
-
61
-
62
-
63
-
64
-
65
-
66
-
67
-
68
-
69
-
70
-
71
-
72
-
73
-
74
-
75
-
76
-
77
-
78
-
79
-
80
-
81
-
82
-
83
-
84
-
85
-
86
-
87
-
88
-
89
-
90
-
91
-
92
-
93
-
94
-
95
-
96
-
97
-
98
-
99
-
100
-
101
-
102
-
103
-
104
-
105
-
106
-
107
-
108
-
109
-
110
-
111
-
112
-
113
-
114
-
115
-
116
-
117
-
118
-
119
-
120
-
121
-
122
 |
 |

MANAGEMENT’S DISCUSSION AND ANALYSIS
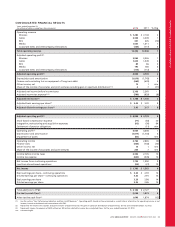
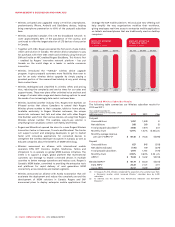
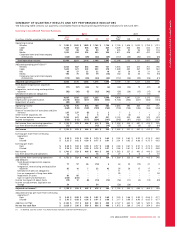
Cable Operating and Financial Results
Summarized Cable Financial Results
Cable’s operating revenue in total grew year-over-year primarily due
to increases in Internet revenue. Cable Television revenue declined as
a result of ongoing competitive pressures in the cable industry.
Despite our expanding base of home telephone subscribers, Home
Phone revenues were relatively flat year-over-year, as a result of the
divestiture of the circuit switched telephony operations and its
associated customer base in 2011. Operating expenses have been held
essentially flat due to our strategic cost management and productivity
initiatives; which has enabled us to deliver a year-over-year increase in
adjusted operating profit.
Years ended December 31,
(In millions of dollars, except margin) 2012 2011 % Chg
Operating revenue
Cable Television $ 1,868 $ 1,878 (1)
Internet 998 926 8
Home Phone 477 478 –
Service revenue 3,343 3,282 2
Equipment sales 15 27 (44)
Total Cable operating revenue 3,358 3,309 1
Operating expenses
Cost of equipment sales (20) (29) (31)
Other operating expenses (1,733) (1,731) –
(1,753) (1,760) –
Adjusted operating profit(1) $ 1,605 $ 1,549 4
Adjusted operating profit margin(1) 47.8% 46.8%
Additions to PP&E $ 832 $ 748 11
(1) As defined. See the section “Key Performance Indicators and Non-GAAP
Measures”.
Cable Operating Highlights for 2012
• Cable grew high-speed Internet subscribers by 71,000 and cable
telephony lines by 22,000, while digital cable households declined
by 9,000.
• Cable’s Internet penetration is now approximately 84% of our
television subscriber base and 49% of the homes passed by our
cable networks. In addition, digital penetration now represents
approximately 80% of television households.
• The cable telephony subscriber base continued to grow, ending the
year with just under 1.1 million residential voice-over-cable
telephony lines, which brought the total penetration of cable
telephony lines to 49% of television subscribers.
• Cable unveiled NextBox 2.0, a suite of new features and
functionality for the Rogers’ home television entertainment
experience that gives customers control over where, when and how
they view their favourite live and recorded programming. During
the year, Cable further enhanced the NextBox 2.0 platform with
the new Rogers Anyplace TV Home edition application for tablets.
It provides a seamless TV and internet experience allowing
customers to watch TV anywhere in their home, across multiple
devices. Rogers is the first Canadian telecommunications company
to offer an integrated remote PVR management and live TV
streaming experience on tablets.
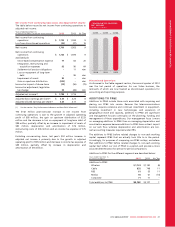
• Cable demonstrated its commitment to bringing leading Internet
experiences to Canadians by increasing speeds across
approximately 90% of its footprint, including doubling the speed
of our Ultimate tier to 150 Mbps. Cable continues to make
significant network investments to deliver the fastest Internet
speeds available to the most homes.
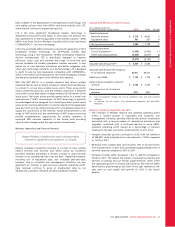
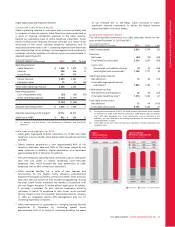
Summarized Subscriber Results
The following table summarizes our Cable subscriber results for the
years ended December 31, 2012 and 2011.
Years ended December 31,
(Subscriber statistics in thousands) 2012 2011 Chg
Cable homes passed 3,810 3,754 56
Television
Net losses (83) (14) (69)
Total television subscribers 2,214 2,297 (83)
Digital cable
Households, net additions (losses) (7) 39 (46)
Total digital cable households(1) 1,768 1,777 (9)
Cable high-speed Internet
Net additions(1) 73 83 (10)
Total cable high-speed Internet
subscribers(1) 1,864 1,793 71
Cable telephony lines
Net additions and migrations 23 45 (22)
Total cable telephony lines(1) 1,074 1,052 22
Total cable service units(2)
Net additions 13 114 (101)
Total cable service units 5,152 5,142 10
(1) During the fourth quarter of 2012, we made internal adjustments which resulted
in reductions of 2,000 Cable Internet subscribers, 2,000 digital cable households
and 1,000 cable telephony lines. These adjustments are not reflected in net
additions, but are reflected in the ending total balance for the twelve months
ended December 31, 2012.
(2) Total cable service units consist of television subscribers, Internet subscribers and
telephony lines.
(In millions of dollars)
CABLE
TOTAL REVENUE
$3,190 $3,309 $3,358
2010 2011 2012
Television Internet Home Phone
(In millions of dollars)
CABLE SERVICE
REVENUE BREAKDOWN
848 926 998
1,803 1,878 1,868
506 478 477
2010 2011 2012
2012 ANNUAL REPORT ROGERS COMMUNICATIONS INC. 39