Rogers 2012 Annual Report Download - page 112
Download and view the complete annual report
Please find page 112 of the 2012 Rogers annual report below. You can navigate through the pages in the report by either clicking on the pages listed below, or by using the keyword search tool below to find specific information within the annual report.-
 1
1 -
2
-
3
-
4
-
5
-
6
-
7
-
8
-
9
-
10
-
11
-
12
-
13
-
14
-
15
-
16
-
17
-
18
-
19
-
20
-
21
-
22
-
23
-
24
-
25
-
26
-
27
-
28
-
29
-
30
-
31
-
32
-
33
-
34
-
35
-
36
-
37
-
38
-
39
-
40
-
41
-
42
-
43
-
44
-
45
-
46
-
47
-
48
-
49
-
50
-
51
-
52
-
53
-
54
-
55
-
56
-
57
-
58
-
59
-
60
-
61
-
62
-
63
-
64
-
65
-
66
-
67
-
68
-
69
-
70
-
71
-
72
-
73
-
74
-
75
-
76
-
77
-
78
-
79
-
80
-
81
-
82
-
83
-
84
-
85
-
86
-
87
-
88
-
89
-
90
-
91
-
92
-
93
-
94
-
95
-
96
-
97
-
98
-
99
-
100
-
101
-
 102
102 -
 103
103 -
 104
104 -
 105
105 -
 106
106 -
 107
107 -
 108
108 -
 109
109 -
 110
110 -
 111
111 -
 112
112 -
 113
113 -
 114
114 -
 115
115 -
 116
116 -
 117
117 -
 118
118 -
 119
119 -
 120
120 -
 121
121 -
 122
122
 |
 |

NOTES TO CONSOLIDATED FINANCIAL STATEMENTS
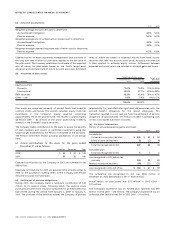
(a) Actuarial assumptions:
2012 2011
Weighted average discount rate used to determine:
Accrued benefit obligation 4.5% 5.5%
Pension expense 5.5% 6.0%
Weighted average rate of compensation increase used to determine:
Accrued benefit obligation 3.0% 3.0%
Pension expense 3.0% 3.0%
Weighted average expected long-term rate of return used to determine:
Pension expense 6.7% 6.8%
Expected return on assets represents management’s best estimate of
the long-term rate of return on plan assets applied to the fair value of
the plan assets. The Company establishes its estimate of the expected
rate of return on plan assets based on the fund’s target asset
allocation and estimated rate of return for each asset class. Estimated
rates of return are based on expected returns from fixed income
securities that take into account bond yields. An equity risk premium
is then applied to estimate equity returns. Differences between
expected and actual return are included in actuarial gains and losses.
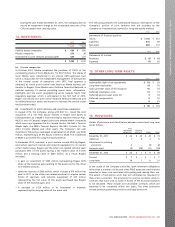
(b) Allocation of plan assets:
Percentage of plan assets Target asset
allocation
percentageAsset category December 31,
2012 December 31,
2011
Equity securities:
Domestic 19.3% 19.0% 10% to 29%
International 38.3% 37.7% 29% to 48%
Debt securities 41.8% 42.4% 38% to 47%
Other – cash 0.6% 0.9% 0% to 2%
100.0% 100.0%
Plan assets are comprised primarily of pooled funds that invest in
common stocks and bonds. The pooled Canadian equity fund has
investments in the Company’s equity securities comprising
approximately 1% of the pooled fund. This results in approximately
$2 million (2011 – $1 million) of the plans’ assets being indirectly
invested in the Company’s equity securities.
The Company makes contributions to the plans to secure the benefits
of plan members and invests in permitted investments using the
target ranges established by the Pension Committee of the Company.
The Pension Committee reviews actuarial assumptions on an annual
basis.
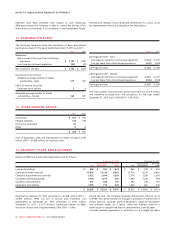
(c) Actual contributions to the plans for the years ended
December 31 are as follows:
Employer Employee Total
2012 $ 85 $ 23 $ 108
2011 80 20 100
Expected contributions by the Company in 2013 are estimated to be
$96 million.
Employee contributions for 2013 are assumed to be at levels similar to
2012 on the assumption staffing levels in the Company will remain
the same on a year-over-year basis.
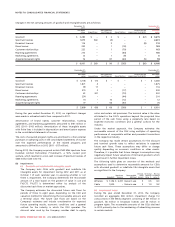
(d) Settlement of pension obligations:
During 2011, the Company made a lump-sum contribution of $18
million to its pension plans, following which the pension plans
purchased annuities from insurance companies for all employees who
had retired during the period from January 1, 2009 to January 1,
2011. The purchase of the annuities relieves the Company of primary
responsibility for, and eliminates significant risk associated with, the
accrued benefit obligations for the retired employees. This
transaction resulted in a non-cash loss from the settlement of pension
obligations of approximately $11 million recorded in operating costs
on the consolidated statement of income.
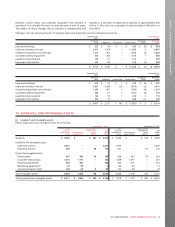
(e) Historical information:
History of annual experience (gains) and losses:
2012 2011 2010
Funded plan:
Actuarial loss on plan liabilities $ 240 $90$82
Effect of asset ceiling limit (1) (2) (4)
Total loss recognized in OCI 239 88 78
Unfunded plan:
Total loss recognized in OCI 512
Loss recognized in OCI, before tax
recovery 244 89 80
Related income tax recovery (64) (22) (21)
Loss recognized in OCI, net of tax $ 180 $67$59
The cumulative loss recognized in OCI was $306 million at
December 31, 2012 (December 31, 2011 – $126 million).
Actual return on plan assets was $75 million in 2012 (2011 –
$27 million).
The Company’s experience loss on funded plan liabilities was $50
million in 2012 (2011 – $16 million). The Company’s experience loss on
unfunded plan liabilities was $nil in 2012 (2011 – $1 million).
108 ROGERS COMMUNICATIONS INC. 2012 ANNUAL REPORT