Rogers 2012 Annual Report Download - page 55
Download and view the complete annual report
Please find page 55 of the 2012 Rogers annual report below. You can navigate through the pages in the report by either clicking on the pages listed below, or by using the keyword search tool below to find specific information within the annual report.-
 1
1 -
2
-
3
-
4
-
5
-
6
-
7
-
8
-
9
-
10
-
11
-
12
-
13
-
14
-
15
-
16
-
17
-
18
-
19
-
20
-
21
-
22
-
23
-
24
-
25
-
26
-
27
-
28
-
29
-
30
-
31
-
32
-
33
-
34
-
35
-
36
-
37
-
38
-
39
-
40
-
41
-
42
-
43
-
44
-
 45
45 -
 46
46 -
 47
47 -
 48
48 -
 49
49 -
 50
50 -
 51
51 -
 52
52 -
 53
53 -
 54
54 -
 55
55 -
 56
56 -
 57
57 -
 58
58 -
 59
59 -
 60
60 -
 61
61 -
 62
62 -
 63
63 -
 64
64 -
 65
65 -
66
-
67
-
68
-
69
-
70
-
71
-
72
-
73
-
74
-
75
-
76
-
77
-
78
-
79
-
80
-
81
-
82
-
83
-
84
-
85
-
86
-
87
-
88
-
89
-
90
-
91
-
92
-
93
-
94
-
95
-
96
-
97
-
98
-
99
-
100
-
101
-
102
-
103
-
104
-
105
-
106
-
107
-
108
-
109
-
110
-
111
-
112
-
113
-
114
-
115
-
116
-
117
-
118
-
119
-
120
-
121
-
122
 |
 |
MANAGEMENT’S DISCUSSION AND ANALYSIS
4. CONSOLIDATED LIQUIDITY AND FINANCING
LIQUIDITY AND CAPITAL RESOURCES
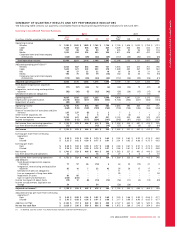
The following table shows the summary of consolidated cash flows:
Years ended December 31,
(In millions of dollars) 2012 2011 % Chg
Cash provided by operating activities $ 3,421 $ 3,791 (10)
Less:
Cash used in investing activities (2,834) (2,831) –
Cash used in financing activities (317) (972) (67)
Change in cash and cash equivalents $ 270 $ (12) n/m
Cash Provided by Operating Activities
For 2012, cash provided by operations before changes in non-cash
operating items, which is calculated by removing the effect of all non-
cash items from net income, increased to $4,729 million, from $4,698
million in 2011. Taking into account the changes in non-cash
operating working capital items, income taxes paid and interest paid
for 2012, cash generated from operations was $3,421 million,
compared to $3,791 million in 2011. The increase in non-cash working
capital and other items for 2012 primarily includes:
• cash used for non-cash working capital items of $248 million, up
$79 million from 2011. These items include a $131 million increase
in other assets primarily due to the increase in inventory and other
prepaids and a $140 million decrease in accounts payable and
accrued liabilities; and
• income taxes paid of $380 million, an increase of $281 million over
2011, as a result of using nearly all of our remaining income tax
loss carryforwards.
Cash Used in Investing Activities
Cash used in investing activities was $2,834 million, compared to
$2,831 in 2011, and includes:
• additions to PP&E of $2,006 million, including $136 million of
related changes in non-cash working capital;
• net investments of $707 million for acquiring theScore and our
37.5% interest in MLSE; and
• payments of program rights and other investments of $121 million.
Cash Used in Financing Activities
Cash used in financing activities was $317 million, compared to $972
million in 2011, and includes:
• $1.1 billion in proceeds from issuance of long-term debt;
• $250 million net repayment of bank debt;
• $350 million for purchase for cancellation of Class B Non-Voting
shares; and
• $803 million payment of dividends.
Taking into account the opening bank advances of $57 million at the
beginning of 2012 and the activities described above, the cash and
cash equivalents at December 31, 2012 were $213 million.
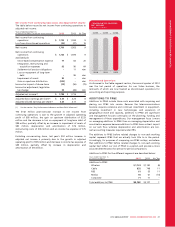
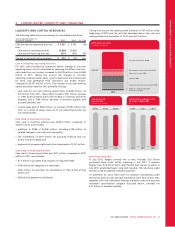
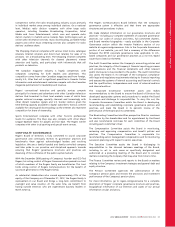
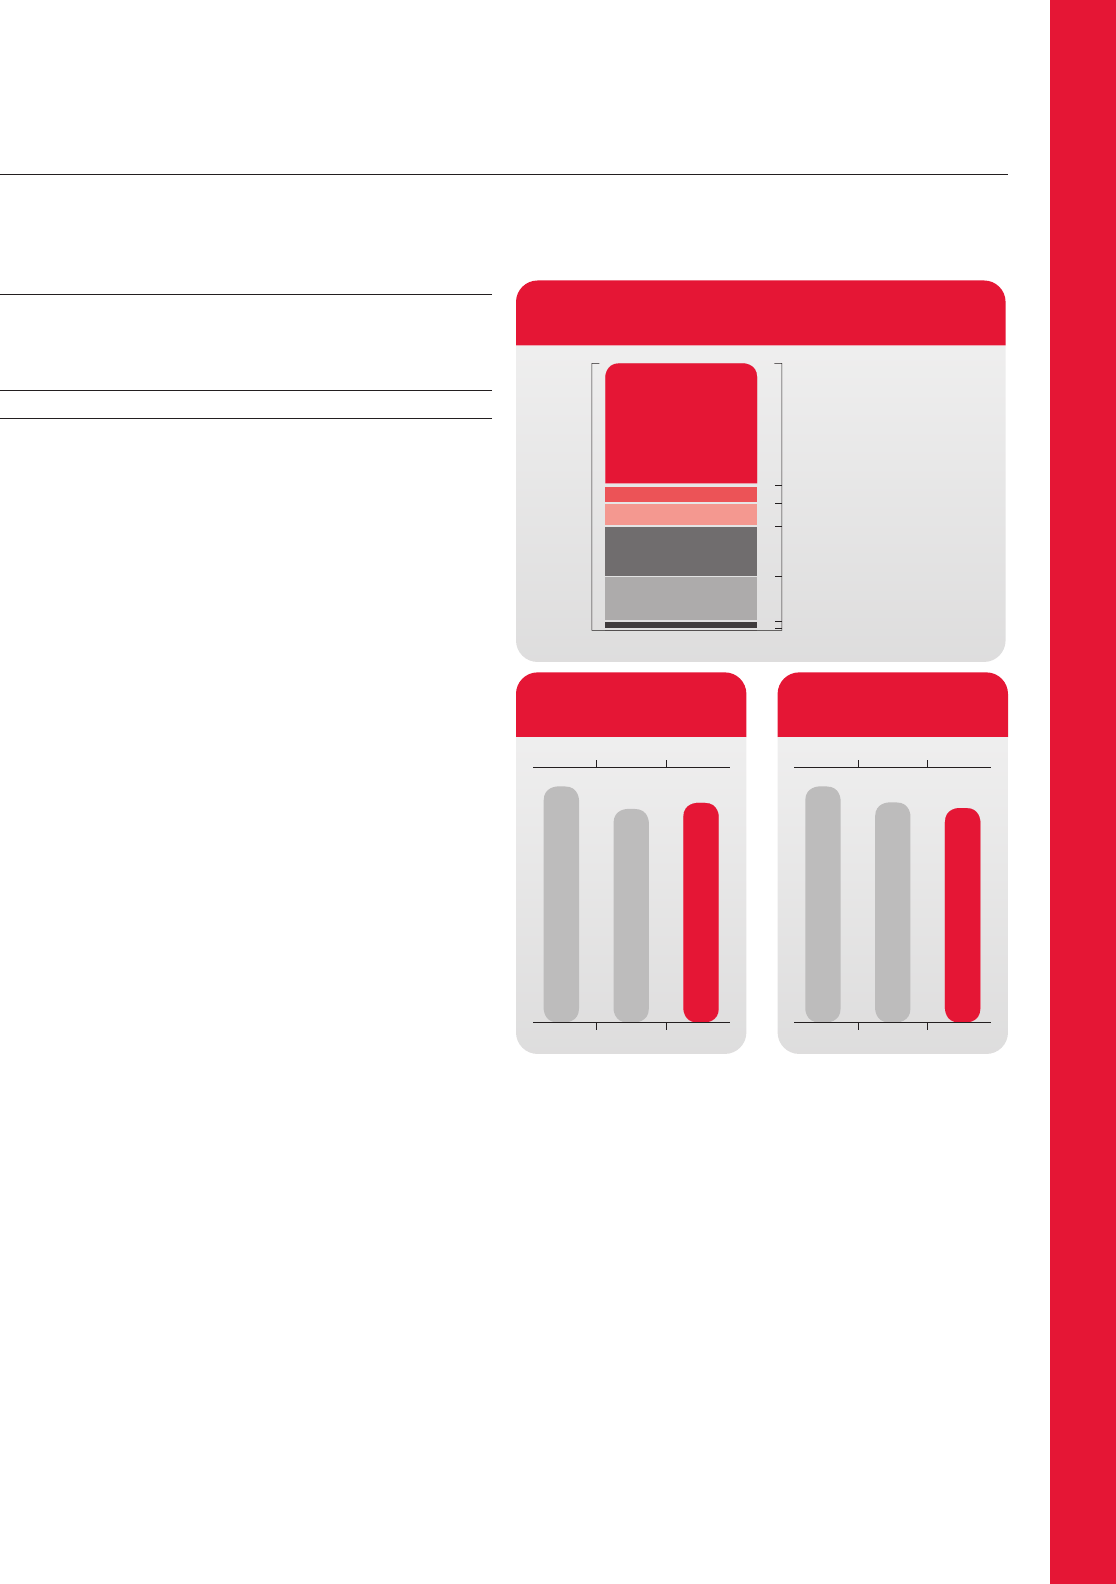
2012 USES OF CASH
2012
$4,251
Cash PP&E expenditures: $2,006
Net repayments under credit facility: $250
Repurchase of shares: $350
Dividends: $803
Acquisitions and other net investments: $738
Additions to program rights: $90
Transaction costs: $14
(In millions of dollars)
(In millions of dollars)
PRE-TAX FREE
CASH FLOW
$2,181 $1,973 $2,029
2010 2011 2012
(%)
WEIGHTED AVERAGE COST
OF LONG-TERM DEBT
6.68% 6.22% 6.06%
2010 2011 2012
Bank Credit Facilities
In July 2012, Rogers entered into a new, five-year $2.0 billion
syndicated bank credit facility maturing in July 2017. It replaces
Rogers’ prior $2.4 billion bank credit facility that was set to expire in
July 2013, extending Rogers’ long-term liquidity. The new bank credit
facility is used for general corporate purposes.
At December 31, 2012, there were no advances outstanding under
this facility and our cash and cash equivalents were $213 million that,
together with the committed funding available under the accounts
receivable securitization program discussed below, provides for
$3.1 billion of available liquidity.
2012 ANNUAL REPORT ROGERS COMMUNICATIONS INC. 51