Rogers 2012 Annual Report Download - page 41
Download and view the complete annual report
Please find page 41 of the 2012 Rogers annual report below. You can navigate through the pages in the report by either clicking on the pages listed below, or by using the keyword search tool below to find specific information within the annual report.-
 1
1 -
2
-
3
-
4
-
5
-
6
-
7
-
8
-
9
-
10
-
11
-
12
-
13
-
14
-
15
-
16
-
17
-
18
-
19
-
20
-
21
-
22
-
23
-
24
-
25
-
26
-
27
-
28
-
29
-
30
-
 31
31 -
 32
32 -
 33
33 -
 34
34 -
 35
35 -
 36
36 -
 37
37 -
 38
38 -
 39
39 -
 40
40 -
 41
41 -
 42
42 -
 43
43 -
 44
44 -
 45
45 -
 46
46 -
 47
47 -
 48
48 -
 49
49 -
 50
50 -
 51
51 -
52
-
53
-
54
-
55
-
56
-
57
-
58
-
59
-
60
-
61
-
62
-
63
-
64
-
65
-
66
-
67
-
68
-
69
-
70
-
71
-
72
-
73
-
74
-
75
-
76
-
77
-
78
-
79
-
80
-
81
-
82
-
83
-
84
-
85
-
86
-
87
-
88
-
89
-
90
-
91
-
92
-
93
-
94
-
95
-
96
-
97
-
98
-
99
-
100
-
101
-
102
-
103
-
104
-
105
-
106
-
107
-
108
-
109
-
110
-
111
-
112
-
113
-
114
-
115
-
116
-
117
-
118
-
119
-
120
-
121
-
122
 |
 |

MANAGEMENT’S DISCUSSION AND ANALYSIS
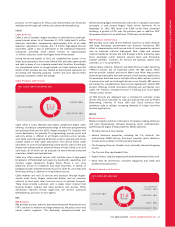
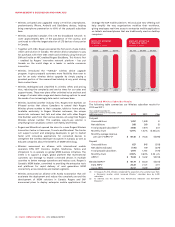
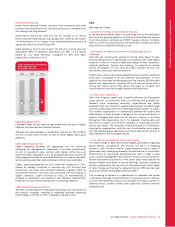
Postpaid Prepaid
1,652 1,761 1,591
7,325 7,574 7,846
2010 2011 2012
(In thousands)
WIRELESS POSTPAID
AND PREPAID SUBSCRIBERS
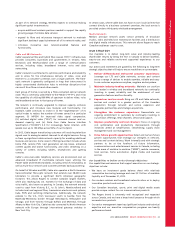
(%)
SMARTPHONES AS A PERCENT
OF POSTPAID SUBSCRIBERS
41.0% 56.0% 69.0%
2010 2011 2012
Wireless Subscribers and Network Revenue
The increase in the number of gross postpaid subscriber additions
during 2012 is primarily the result of demand for smartphones as
Wireless activated and upgraded approximately 2.9 million
smartphones, compared to approximately 2.5 million in 2011. These
smartphones were predominately iPhone, Android and BlackBerry
devices, of which approximately 33% were for new Wireless
subscribers. This is the largest number of annual smartphone
activations and new smartphone customer additions that Wireless has
ever reported. At year-end, subscribers with smartphones represented
69% of the overall postpaid subscriber base, versus 56% at the end of
2011. These subscribers generally commit to multi-year term contracts
and typically generate significantly higher ARPU.
Overall, net additions of postpaid subscribers were relatively
consistent with 2011 levels, which primarily reflects heightened
competitive intensity, offset by a continued reduction in postpaid
churn. The year-over-year decrease in overall prepaid subscriber net
additions primarily reflects an increase in the level of churn associated
with heightened competitive intensity, particularly at the lower end
of the wireless market where the prepaid product is most penetrated.
Network revenue includes revenue derived from voice and data
services from postpaid monthly fees, airtime, data usage, long
distance charges, optional service charges, inbound and outbound
roaming charges and certain fees, as well as prepaid usage for
airtime, data and other ancillary charges such as long distance and
roaming.
The increase in network revenue compared to 2011 reflects the
continued growth of Wireless’ subscriber base and the escalating
adoption and usage of wireless data services, partially offset by a
decrease in voice ARPU due in large part to heightened competitive
intensity.
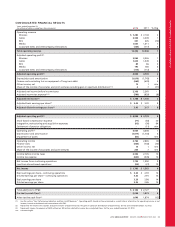
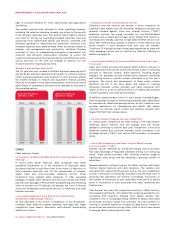
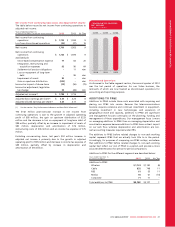
Wireless data revenue increased by 17% from 2011, to $2,722 million.
This growth reflects the continuing proliferation of smartphones,
tablets and wireless laptop devices, all of which are expanding
consumption of apps, mobile video, text messaging and other
wireless data services. In 2012, data revenue represented
approximately 41% of total network revenue, compared to 35%
in 2011.
(In millions of dollars)
WIRELESS DATA
REVENUE
$1,832 $2,325 $2,722
2010 2011 2012
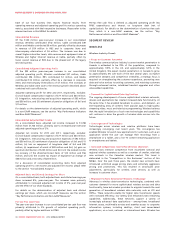
(%)
DATA REVENUE PERCENT
OF BLENDED ARPU
28.1% 35.2% 40.5%
2010 2011 2012
Year-over-year blended ARPU dropped by 1%, driven by an 8.8%
decline in the wireless voice component of blended ARPU primarily
due to competitive intensity in this market, significantly offset by a
14.2% increase in wireless data ARPU.
Wireless Equipment Sales
Equipment sales, net of subsidies, consist of revenue generated from
the sale, generally at or below our cost to independent dealers,
agents and retailers, and directly to subscribers through fulfillment by
Wireless’ customer service groups, websites and telesales. The increase
in revenue from equipment sales for 2012 versus 2011, including
activation fees and net of equipment subsidies, reflects growth in
smartphone activations to the highest levels ever reported by
Wireless, as previously noted.
Wireless Operating Expenses
For assessing business performance, Wireless’ operating expenses are
segregated between cost of equipment, which is composed of
wireless handset and device costs, and other operating expenses,
which include expenses incurred to operate the business on a day-to-
day basis, service existing subscriber relationships and attract new
subscribers.
The $160 million increase in cost of equipment compared to 2011 was
primarily the result of an increase in both hardware upgrades and
smartphone users. A large number of existing iPhone and BlackBerry
subscribers became eligible for subsidized device upgrades during the
second half of 2012. We also activated and upgraded 39% more
iPhones and 16% more smartphones overall than during 2011 and
this was the largest factor behind the year-over-year increase in
expenses. Wireless views these costs as net present value positive
investments in the acquisition and retention of higher ARPU
subscribers, as these customers tend to be lower churning customers
who subscribe to multi-year term contracts and consume higher data
usage.
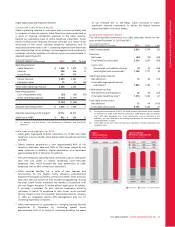
Total retention spending, including subsidies on handset upgrades,
increased to $942 million, up from $813 million in 2011. This stemmed
from higher volumes of smartphones and a mix of more expensive
smartphones. Increased spending is part of our retention strategy in
2012 ANNUAL REPORT ROGERS COMMUNICATIONS INC. 37