Rogers 2012 Annual Report Download - page 53
Download and view the complete annual report
Please find page 53 of the 2012 Rogers annual report below. You can navigate through the pages in the report by either clicking on the pages listed below, or by using the keyword search tool below to find specific information within the annual report.-
 1
1 -
2
-
3
-
4
-
5
-
6
-
7
-
8
-
9
-
10
-
11
-
12
-
13
-
14
-
15
-
16
-
17
-
18
-
19
-
20
-
21
-
22
-
23
-
24
-
25
-
26
-
27
-
28
-
29
-
30
-
31
-
32
-
33
-
34
-
35
-
36
-
37
-
38
-
39
-
40
-
41
-
42
-
 43
43 -
 44
44 -
 45
45 -
 46
46 -
 47
47 -
 48
48 -
 49
49 -
 50
50 -
 51
51 -
 52
52 -
 53
53 -
 54
54 -
 55
55 -
 56
56 -
 57
57 -
 58
58 -
 59
59 -
 60
60 -
 61
61 -
 62
62 -
 63
63 -
64
-
65
-
66
-
67
-
68
-
69
-
70
-
71
-
72
-
73
-
74
-
75
-
76
-
77
-
78
-
79
-
80
-
81
-
82
-
83
-
84
-
85
-
86
-
87
-
88
-
89
-
90
-
91
-
92
-
93
-
94
-
95
-
96
-
97
-
98
-
99
-
100
-
101
-
102
-
103
-
104
-
105
-
106
-
107
-
108
-
109
-
110
-
111
-
112
-
113
-
114
-
115
-
116
-
117
-
118
-
119
-
120
-
121
-
122
 |
 |

MANAGEMENT’S DISCUSSION AND ANALYSIS
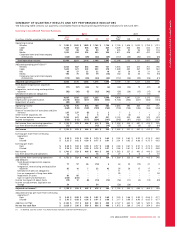
SUMMARY OF QUARTERLY RESULTS AND KEY PERFORMANCE INDICATORS
The following table contains our quarterly consolidated financial results and key performance indicators for 2012 and 2011.
Quarterly Consolidated Financial Summary
2012 2011
(In millions of dollars, except per share amounts)
Full
Year Q4 Q3 Q2 Q1 Full
Year Q4 Q3 Q2 Q1
Operating revenue
Wireless $ 7,280 $ 1,920 $ 1,889 $ 1,765 $ 1,706 $ 7,138 $ 1,826 $ 1,832 $ 1,759 $ 1,721
Cable 3,358 852 838 843 825 3,309 838 826 832 813
RBS 351 88 86 90 87 405 93 96 100 116
Media 1,620 434 392 440 354 1,611 428 407 437 339
Corporate items and intercompany
eliminations (123) (33) (29) (32) (29) (117) (30) (30) (31) (26)
Total operating revenue 12,486 3,261 3,176 3,106 2,943 12,346 3,155 3,131 3,097 2,963
Adjusted operating profit (loss)(1)
Wireless 3,063 687 843 796 737 3,036 670 815 761 790
Cable 1,605 421 403 403 378 1,549 403 367 397 382
RBS 89 27 22 22 18 86 20 19 21 26
Media 190 75 50 79 (14) 180 44 55 91 (10)
Corporate items and intercompany
eliminations (113) (34) (30) (24) (25) (112) (36) (29) (26) (21)
Adjusted operating profit(1) 4,834 1,176 1,288 1,276 1,094 4,739 1,101 1,227 1,244 1,167
Stock-based compensation (expense)
recovery (77) (57) (26) 12 (6) (64) (34) 19 (41) (8)
Integration, restructuring and acquisition
expenses (92) (10) (7) (33) (42) (56) (20) (15) (17) (4)
Settlement of pension obligations –––– –(11) – – (11) –
Operating profit(1) 4,665 1,109 1,255 1,255 1,046 4,608 1,047 1,231 1,175 1,155
Depreciation and amortization (1,819) (453) (437) (466) (463) (1,743) (454) (427) (444) (418)
Impairment of assets (80) (80) – – – –––––
Operating income 2,766 576 818 789 583 2,865 593 804 731 737
Finance costs (664) (176) (169) (159) (160) (738) (158) (146) (166) (268)
Share of income (loss) of associates and joint
ventures 235 237 (8) 3 3 731–3
Other income (expense), net 15424 5 1 (6) – 5 2
Net income before income taxes 2,352 641 643 637 431 2,135 432 659 570 474
Income tax expense (620) (112) (177) (224) (107) (545) (97) (162) (157) (129)
Net income from continuing operations $ 1,732 $ 529 $ 466 $ 413 $ 324 $ 1,590 $ 335 $ 497 $ 413 $ 345
Loss from discontinued operations (32) – – (13) (19) (27) (8) (6) (3) (10)
Net income $ 1,700 $ 529 $ 466 $ 400 $ 305 $ 1,563 $ 327 $ 491 $ 410 $ 335
Earnings per share from continuing
operations:
Basic $ 3.34 $ 1.03 $ 0.90 $ 0.79 $ 0.62 $ 2.93 $ 0.63 $ 0.92 $ 0.76 $ 0.62
Diluted $ 3.32 $ 1.02 $ 0.90 $ 0.77 $ 0.61 $ 2.91 $ 0.63 $ 0.88 $ 0.75 $ 0.62
Earnings per share:
Basic $ 3.28 $ 1.03 $ 0.90 $ 0.77 $ 0.58 $ 2.88 $ 0.61 $ 0.91 $ 0.75 $ 0.60
Diluted $ 3.26 $ 1.02 $ 0.90 $ 0.75 $ 0.57 $ 2.86 $ 0.61 $ 0.87 $ 0.74 $ 0.60
Net income $ 1,700 $ 529 $ 466 $ 400 $ 305 $ 1,563 $ 327 $ 491 $ 410 $ 335
Loss from discontinued operations 32 – – 13 19 27 8 6 3 10
Net income from continuing operations $ 1,732 $ 529 $ 466 $ 413 $ 324 $ 1,590 $ 335 $ 497 $ 413 $ 345
Add (deduct):
Stock-based compensation expense
(recovery) 77 57 26 (12) 6 64 34 (19) 41 8
Integration, restructuring and acquisition
expenses 92 10 7 33 42 56 20 15 17 4
Settlement of pension obligations –––– –11 – – 11 –
Loss on repayment of long-term debt –––– –99 – – – 99
Impairment of assets 80 80 – – – –––––
Gain on spectrum distribution (233) (233) – – – –––––
Income tax impact of above items (14) 12 (4) (10) (12) (56) (11) (4) (13) (28)
Income tax adjustment, legislative tax
change 54 – – 54 – (28) (28) – – –
Adjusted net income(1) $ 1,788 $ 455 $ 495 $ 478 $ 360 $ 1,736 $ 350 $ 489 $ 469 $ 428
Adjusted earnings per share from continuing
operations(1):
Basic $ 3.45 $ 0.88 $ 0.96 $ 0.92 $ 0.69 $ 3.20 $ 0.66 $ 0.90 $ 0.86 $ 0.77
Diluted $ 3.43 $ 0.88 $ 0.96 $ 0.91 $ 0.68 $ 3.17 $ 0.66 $ 0.90 $ 0.85 $ 0.77
Additions to PP&E $ 2,142 $ 707 $ 528 $ 458 $ 449 $ 2,127 $ 653 $ 559 $ 520 $ 395
Pre-tax free cash flow $ 2,029 $ 296 $ 589 $ 656 $ 488 $ 1,973 $ 289 $ 510 $ 564 $ 610
(1) As defined. See the section “Key Performance Indicators and Non-GAAP Measures”.
2012 ANNUAL REPORT ROGERS COMMUNICATIONS INC. 49