Rogers 2012 Annual Report Download - page 44
Download and view the complete annual report
Please find page 44 of the 2012 Rogers annual report below. You can navigate through the pages in the report by either clicking on the pages listed below, or by using the keyword search tool below to find specific information within the annual report.-
 1
1 -
2
-
3
-
4
-
5
-
6
-
7
-
8
-
9
-
10
-
11
-
12
-
13
-
14
-
15
-
16
-
17
-
18
-
19
-
20
-
21
-
22
-
23
-
24
-
25
-
26
-
27
-
28
-
29
-
30
-
31
-
32
-
33
-
 34
34 -
 35
35 -
 36
36 -
 37
37 -
 38
38 -
 39
39 -
 40
40 -
 41
41 -
 42
42 -
 43
43 -
 44
44 -
 45
45 -
 46
46 -
 47
47 -
 48
48 -
 49
49 -
 50
50 -
 51
51 -
 52
52 -
 53
53 -
 54
54 -
55
-
56
-
57
-
58
-
59
-
60
-
61
-
62
-
63
-
64
-
65
-
66
-
67
-
68
-
69
-
70
-
71
-
72
-
73
-
74
-
75
-
76
-
77
-
78
-
79
-
80
-
81
-
82
-
83
-
84
-
85
-
86
-
87
-
88
-
89
-
90
-
91
-
92
-
93
-
94
-
95
-
96
-
97
-
98
-
99
-
100
-
101
-
102
-
103
-
104
-
105
-
106
-
107
-
108
-
109
-
110
-
111
-
112
-
113
-
114
-
115
-
116
-
117
-
118
-
119
-
120
-
121
-
122
 |
 |
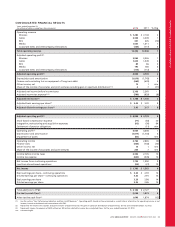
MANAGEMENT’S DISCUSSION AND ANALYSIS
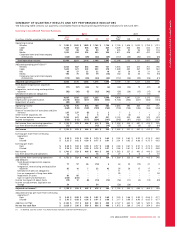
(In millions of dollars)
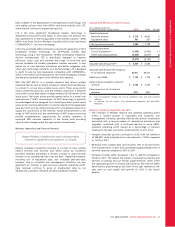
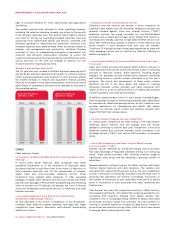
CABLE ADJUSTED OPERATING
PROFIT AND ADJUSTED PROFIT
MARGIN
$1,419 $1,549 $1,605
2010 2011 2012
44.5%
46.8% 47.8%
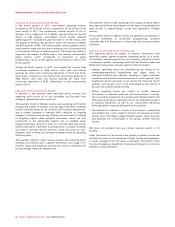
Television Digital
Internet Home Phone
(In thousands)
CABLE SUBSCRIBER
BREAKDOWN
1,733 1,777 1,768
2,305 2,297 2,214
1,686 1,793 1,864
1,003 1,052 1,074
2010 2011 2012
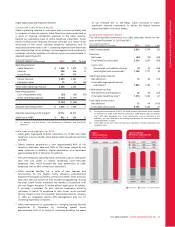
Cable Television Revenue
Cable Television revenue includes revenue derived from: (i) analog
cable service, consisting of basic cable service fees plus extended basic
(or tier) service fees and access fees for use of channel capacity by
third and related parties; (ii) digital cable service revenue, consisting
of digital channel service fees, including premium and specialty
service subscription fees, pay per view service fees and video on
demand service fees; and (iii) rental of digital cable set-top terminals.
The decrease in Cable Television revenue in 2012 reflects the
increased competitive intensity in our operating territory, which has
led to increased retention and promotional pricing activity and a
partial erosion of our basic Television subscriber base. Cable
Television revenue includes the effect of annual pricing changes that
took place in March 2012 and March 2011. Cable continues to offer
competitive strategic bundling and retention initiatives to transition
portions of the subscriber base to term contracts.
The digital cable subscriber base now represents 80% of television
households passed by our cable networks, compared to 77% at the
end of 2011. Increased demand from subscribers for the larger
selection of digital content, video on demand, and HDTV and PVR
equipment continues to contribute to the growth in digital services
into our Television subscriber base.
Cable began a substantial conversion of the remaining analog cable
customers onto its digital cable platform during 2012. This strategic
migration will further strengthen the customer experience, enable
the reclamation of significant amounts of network capacity, and
reduce network operating and maintenance costs going forward. The
analog to digital migration, expected through 2013, entails
incremental PP&E and operating costs as each of the remaining
analog homes are fitted with digital converters and various analog
filtering equipment is removed.
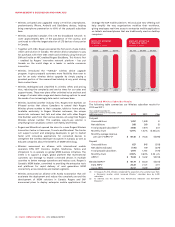
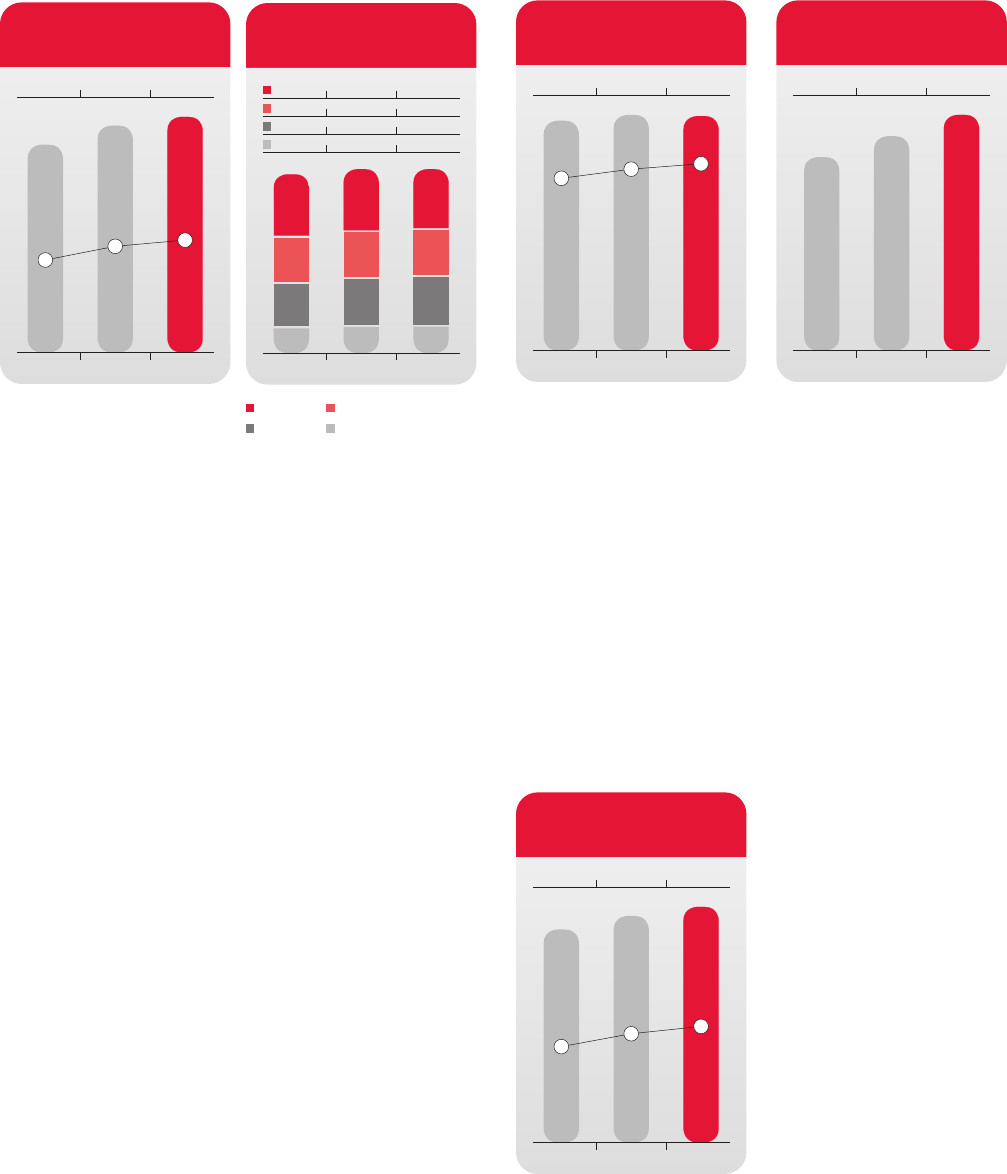
(In thousands)
DIGITAL HOUSEHOLDS AND
PENETRATION OF TELEVISION
CUSTOMERS
1,733 1,777 1,768
2010 2011 2012
75%
77% 80%
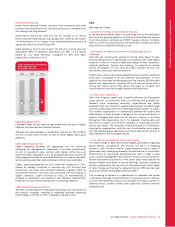
(In thousands)
HIGH-DEFINITION
HOUSEHOLDS
850 942 1,039
2010 2011 2012
Internet Revenue
Internet revenue includes monthly and additional use service
revenues from residential, small business and wholesale Internet
access subscribers and modem rental fees.
Internet revenue increased in 2012 primarily due to the growth in
Internet subscribers, combined with Internet services price changes
made over the previous 12 months. Also impacting the increase was
the timing and mix of promotional programs, a general movement by
subscribers towards higher-end tiers offering faster speeds and larger
monthly usage limits, a modest increase in revenue from additional
usage, and a mix of retail and wholesale subscribers.
With the high-speed Internet customer base at approximately 1.9
million subscribers, Internet penetration is now at approximately 84%
of our television subscriber base and 49% of the homes passed by our
cable networks, compared to penetration of approximately 78% of
our television subscriber base and 48% of the homes passed by our
cable network at the end of 2011.
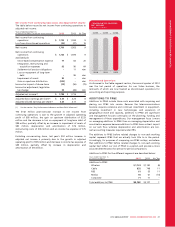
(In thousands)
INTERNET SUBSCRIBERS
AND PENETRATION
OF HOMES PASSED
1,686 1,793 1,864
2010 2011 2012
45%
48% 49%
40 ROGERS COMMUNICATIONS INC. 2012 ANNUAL REPORT