Rogers 2012 Annual Report Download - page 52
Download and view the complete annual report
Please find page 52 of the 2012 Rogers annual report below. You can navigate through the pages in the report by either clicking on the pages listed below, or by using the keyword search tool below to find specific information within the annual report.-
 1
1 -
2
-
3
-
4
-
5
-
6
-
7
-
8
-
9
-
10
-
11
-
12
-
13
-
14
-
15
-
16
-
17
-
18
-
19
-
20
-
21
-
22
-
23
-
24
-
25
-
26
-
27
-
28
-
29
-
30
-
31
-
32
-
33
-
34
-
35
-
36
-
37
-
38
-
39
-
40
-
41
-
 42
42 -
 43
43 -
 44
44 -
 45
45 -
 46
46 -
 47
47 -
 48
48 -
 49
49 -
 50
50 -
 51
51 -
 52
52 -
 53
53 -
 54
54 -
 55
55 -
 56
56 -
 57
57 -
 58
58 -
 59
59 -
 60
60 -
 61
61 -
 62
62 -
63
-
64
-
65
-
66
-
67
-
68
-
69
-
70
-
71
-
72
-
73
-
74
-
75
-
76
-
77
-
78
-
79
-
80
-
81
-
82
-
83
-
84
-
85
-
86
-
87
-
88
-
89
-
90
-
91
-
92
-
93
-
94
-
95
-
96
-
97
-
98
-
99
-
100
-
101
-
102
-
103
-
104
-
105
-
106
-
107
-
108
-
109
-
110
-
111
-
112
-
113
-
114
-
115
-
116
-
117
-
118
-
119
-
120
-
121
-
122
 |
 |

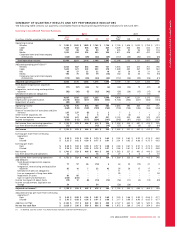
MANAGEMENT’S DISCUSSION AND ANALYSIS
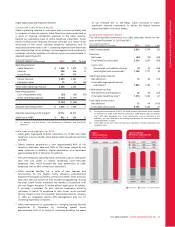
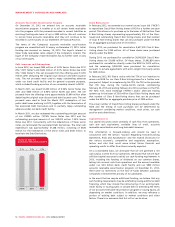
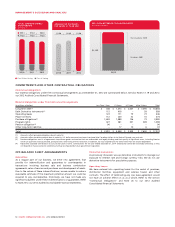
Wireless Additions to PP&E
Wireless PP&E additions for 2012 reflect our strategy to maintain our
leadership in Wireless network deployment, with spending to extend
our LTE footprint, improve the user experience and network
reliability.
Wireless segment capital expenditures decreased year-over-year by
6%, or $69 million, to $1,123 million and Wireless capital intensity
improved to 17%, from 18% in 2011. The decrease in Wireless
additions to PP&E is attributable to increased spending on the
continued deployment of our LTE network, offset by lower HSPA+
capacity investments and the timing of spend on cell site construction,
customer billing systems and the development costs of the Rogers
One Number service incurred in the prior year.
WIRELESS 52% CABLE 39%
(%)
2012 ADDITIONS TO PP&E
$2.1
BILLION
RBS 3%
MEDIA 3%
CORPORATE 3%
Cable Additions to PP&E
The Cable segment capital expenditures increased year-over-year by
$84 million, or 11%, during 2012 to $832 million, and accordingly,
Cable’s capital intensity increased to 25% from 23% in 2011. This
increase was driven by continued investments in the cable network to
enhance the customer experience through increased speed and
performance of our Internet service and capacity enhancements to
our digital network to allow for incremental HD and on-demand
services to be added. Higher analog to digital subscriber migration
activity and investments in customer premise equipment related to
the Next Box 2.0 program also contributed to the increase in
additions to PP&E, partially offset by timing of spend on projects
related to customer billing systems.
RBS Additions to PP&E
The increase in RBS PP&E additions for 2012 reflects increased activity
and timing of expenditures on customer networks and support
capital.
Media Additions to PP&E
Media’s PP&E additions during 2012 primarily reflects expenditures on
digital and broadcast systems and infrastructure upgrades for Sports
Entertainment facilities.
EMPLOYEES
Employee salaries and benefits represent a material portion of our
expenses. At December 31, 2012, we had 26,801 (2011 – 28,745)
employees across all of our operating groups, including our shared
services organization and corporate office. Total salaries and benefits
for employees (both full and part-time) in 2012 was approximately
$1,813 million, up from $1,742 million in 2011. This was due to higher
baseball player costs, higher employee benefit costs and an increase
in stock-based compensation expense compared to 2011 due to a
larger increase in our stock price.
48 ROGERS COMMUNICATIONS INC. 2012 ANNUAL REPORT