Rogers 2012 Annual Report Download - page 76
Download and view the complete annual report
Please find page 76 of the 2012 Rogers annual report below. You can navigate through the pages in the report by either clicking on the pages listed below, or by using the keyword search tool below to find specific information within the annual report.-
 1
1 -
2
-
3
-
4
-
5
-
6
-
7
-
8
-
9
-
10
-
11
-
12
-
13
-
14
-
15
-
16
-
17
-
18
-
19
-
20
-
21
-
22
-
23
-
24
-
25
-
26
-
27
-
28
-
29
-
30
-
31
-
32
-
33
-
34
-
35
-
36
-
37
-
38
-
39
-
40
-
41
-
42
-
43
-
44
-
45
-
46
-
47
-
48
-
49
-
50
-
51
-
52
-
53
-
54
-
55
-
56
-
57
-
58
-
59
-
60
-
61
-
62
-
63
-
64
-
65
-
 66
66 -
 67
67 -
 68
68 -
 69
69 -
 70
70 -
 71
71 -
 72
72 -
 73
73 -
 74
74 -
 75
75 -
 76
76 -
 77
77 -
 78
78 -
 79
79 -
 80
80 -
 81
81 -
 82
82 -
 83
83 -
 84
84 -
 85
85 -
 86
86 -
87
-
88
-
89
-
90
-
91
-
92
-
93
-
94
-
95
-
96
-
97
-
98
-
99
-
100
-
101
-
102
-
103
-
104
-
105
-
106
-
107
-
108
-
109
-
110
-
111
-
112
-
113
-
114
-
115
-
116
-
117
-
118
-
119
-
120
-
121
-
122
 |
 |

MANAGEMENT’S DISCUSSION AND ANALYSIS
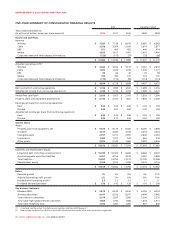
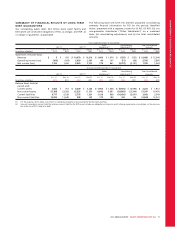
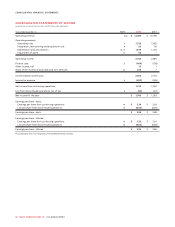
FIVE-YEAR SUMMARY OF CONSOLIDATED FINANCIAL RESULTS
IFRS Canadian GAAP
Years Ended December 31,
(In millions of dollars, except per share amounts) 2012 2011 2010 2009 2008
Income and Cash Flow:
Revenue
Wireless $ 7,280 $ 7,138 $ 6,973 $ 6,685 $ 6,343
Cable 3,358 3,309 3,190 3,074 2,877
RBS 351 405 452 446 474
Media 1,620 1,611 1,461 1,407 1,496
Corporate items and intercompany eliminations (123) (117) (77) (75) (80)
$ 12,486 $ 12,346 $ 11,999 $ 11,537 $ 11,110
Adjusted operating profit(1)
Wireless $ 3,063 $ 3,036 $ 3,173 $ 3,067 $ 2,818
Cable 1,605 1,549 1,419 1,300 1,171
RBS 89 86 40 35 59
Media 190 180 131 119 142
Corporate items and intercompany eliminations (113) (112) (95) (114) (115)
$ 4,834 $ 4,739 $ 4,668 $ 4,407 $ 4,075
Net income from continuing operations $ 1,732 $ 1,590 $ 1,532 $ 1,499 $ 1,016
Adjusted net income from continuing operations(1) $ 1,788 $ 1,736 $ 1,704 $ 1,569 $ 1,272
Pre-tax free cash flow(1) $ 2,029 $ 1,973 $ 2,181 $ 1,919 $ 1,500
Property, plant and equipment expenditures $ 2,142 $ 2,127 $ 1,821 $ 1,841 $ 2,000
Earnings per share from continuing operations:
Basic $ 3.34 $ 2.93 $ 2.66 $ 2.41 $ 1.59
Diluted 3.32 2.91 2.64 2.41 1.59
Adjusted net income per share from continuing operations:
Basic $ 3.45 $ 3.20 $ 2.96 $ 2.53 $ 1.99
Diluted 3.43 3.17 2.94 2.53 1.99
Balance Sheet:
Assets
Property, plant and equipment, net $ 9,576 $ 9,114 $ 8,437 $ 8,197 $ 7,898
Goodwill 3,215 3,280 3,108 3,018 3,024
Intangible assets 2,951 2,721 2,591 2,643 2,761
Investments 1,484 1,107 933 563 343
Other assets 2,392 2,140 1,964 2,597 3,056
$ 19,618 $ 18,362 $ 17,033 $ 17,018 $ 17,082
Liabilities and Shareholders’ Equity
Long-term debt (including current portion) $ 10,789 $ 10,034 $ 8,654 $ 8,464 $ 8,507
Accounts payable and other liabilities 5,061 4,756 4,619 4,281 3,859
Total liabilities 15,850 14,790 13,273 12,745 12,366
Shareholders’ equity 3,768 3,572 3,760 4,273 4,716
$ 19,618 $ 18,362 $ 17,033 $ 17,018 $ 17,082
Ratios:
Revenue growth 1% 3% 4% 4% 11%
Adjusted operating profit growth 2% 2% 6% 8% 10%
Debt/adjusted operating profit(2) 2.3 2.2 2.1 2.1 2.1
Dividends declared per share $ 1.58 $ 1.42 $ 1.28 $ 1.16 $ 1.00
Key business indicators:
Blended ARPU $ 59.79 $ 60.20 $ 62.62 $ 63.59 $ 64.34
Wireless subscribers 9,437 9,335 8,977 8,494 7,942
Total television subscribers 2,214 2,297 2,305 2,296 2,320
Total cable high-speed internet subscribers 1,864 1,793 1,686 1,619 1,571
Total cable telephony lines 1,074 1,052 1,003 937 840
(1) As defined. See the section “Key Performance Indicators and Non-GAAP Measures”.
(2) Debt includes net derivative liabilities at the credit-adjusted mark-to-market value and is net of cash as applicable.
72 ROGERS COMMUNICATIONS INC. 2012 ANNUAL REPORT