Rogers 2012 Annual Report Download - page 38
Download and view the complete annual report
Please find page 38 of the 2012 Rogers annual report below. You can navigate through the pages in the report by either clicking on the pages listed below, or by using the keyword search tool below to find specific information within the annual report.-
 1
1 -
2
-
3
-
4
-
5
-
6
-
7
-
8
-
9
-
10
-
11
-
12
-
13
-
14
-
15
-
16
-
17
-
18
-
19
-
20
-
21
-
22
-
23
-
24
-
25
-
26
-
27
-
 28
28 -
 29
29 -
 30
30 -
 31
31 -
 32
32 -
 33
33 -
 34
34 -
 35
35 -
 36
36 -
 37
37 -
 38
38 -
 39
39 -
 40
40 -
 41
41 -
 42
42 -
 43
43 -
 44
44 -
 45
45 -
 46
46 -
 47
47 -
 48
48 -
49
-
50
-
51
-
52
-
53
-
54
-
55
-
56
-
57
-
58
-
59
-
60
-
61
-
62
-
63
-
64
-
65
-
66
-
67
-
68
-
69
-
70
-
71
-
72
-
73
-
74
-
75
-
76
-
77
-
78
-
79
-
80
-
81
-
82
-
83
-
84
-
85
-
86
-
87
-
88
-
89
-
90
-
91
-
92
-
93
-
94
-
95
-
96
-
97
-
98
-
99
-
100
-
101
-
102
-
103
-
104
-
105
-
106
-
107
-
108
-
109
-
110
-
111
-
112
-
113
-
114
-
115
-
116
-
117
-
118
-
119
-
120
-
121
-
122
 |
 |
MANAGEMENT’S DISCUSSION AND ANALYSIS
Each of our four business lines reports financial results, from
operating revenue and adjusted operating profit to various operating
metrics, associated with their respective businesses. Please refer to the
relevant sections in this MD&A for details.
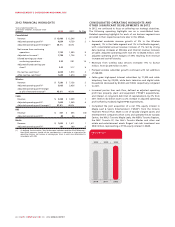
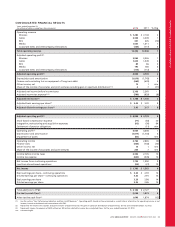
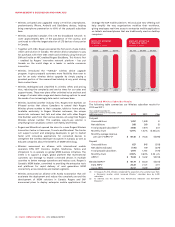
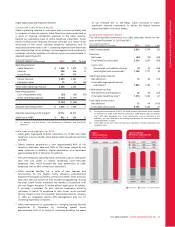
Consolidated Revenue
Of the $140 million year-over-year increase in our consolidated
revenue, Wireless contributed $142 million, Cable contributed $49
million and Media contributed $9 million, partially offset by decreases
in revenue of $54 million in RBS and in corporate items and
intercompany eliminations of $6 million. The increase was due to
overall higher subscriber levels, data revenue and equipment sales at
Wireless and higher Internet revenue at Cable, partially offset by
lower overall revenue at RBS due to the phased exit of the legacy
services business.
Consolidated Adjusted Operating Profit
Of the $95 million year-over-year increase in our consolidated
adjusted operating profit, Wireless contributed $27 million, Cable
contributed $56 million, RBS contributed $3 million, and Media
contributed $10 million, partially offset by a decrease in corporate
items and intercompany eliminations of $1 million. The increases at
Wireless and Cable were due to the revenue growth described above
combined with cost efficiencies.
Adjusted operating profit for 2012 and 2011, respectively, excludes:
(i) stock-based compensation expense of $77 million and $64 million;
(ii) integration, restructuring and acquisition expenses of $92 million
and $56 million; and (iii) settlement of pension obligations of $nil and
$11 million.
For details on the determination of adjusted operating profit, which
is a non-GAAP measure, see the section “Key Performance Indicators
and Non-GAAP Measures”.
Consolidated Adjusted Net Income
On a consolidated basis, adjusted net income increased to $1,788
million from $1,736 million, primarily due to increased year-over-year
adjusted operating profits of 2%.
Adjusted net income for 2012 and 2011, respectively, excludes:
(i) stock-based compensation expense of $77 million and $64 million;
(ii) integration, restructuring and acquisition expenses of $92 million
and $56 million; (iii) settlement of pension obligations of $nil and $11
million; (iv) loss on repayment of long-term debt of $nil and $99
million; (v) impairment of assets of $80 million and $nil; (vi) gain on
spectrum distribution of $233 million and $nil; (vii) the related income
tax recovery of the aforementioned items of $14 million and $56
million; and (viii) the income tax impact of legislative tax change of
$54 million and a recovery of $28 million.
For a discussion of consolidated reconciling items from adjusted
operating profit to net income and adjusted net income, please refer
to the section “Consolidated Analysis”.
Adjusted Basic and Diluted Earnings Per Share
On a consolidated basis, both adjusted basic and diluted earnings per
share increased 8%, year-over-year. The increases were primarily
attributable to increased adjusted net income of 3% year-over-year
and the effect of our share buybacks.
For details on the determination of adjusted basic and diluted
earnings per share, which are non-GAAP measures, see the section
“Key Performance Indicators and Non-GAAP Measures”.
Pre-tax Free Cash Flow
The year-over-year increase in our consolidated pre-tax cash flow was
primarily attributed to 2% growth of adjusted operating profit,
partially offset by higher additions to PP&E.
Pre-tax free cash flow is defined as adjusted operating profit less
PP&E expenditures and interest on long-term debt (net of
capitalization). For details on the determination of pre-tax free cash
flow, which is a non-GAAP measure, see the section “Key
Performance Indicators and Non-GAAP Measures”.
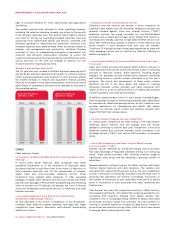
SEGMENT REVIEW
WIRELESS
Wireless Industry Trends
> Focus on Customer Retention
The wireless communications industry’s current market penetration in
Canada is estimated to be 78% of the population, compared to
approximately 109% in the U.S. and approximately 123% in the
United Kingdom. We expect market penetration in Canada to grow
by approximately 4% over each of the next several years. As market
penetration deepens and competition intensifies, a strategic focus is
required on strengthening the customer experience, promoting new
data and voice services to existing customers, and retaining customers
through enhanced service, subsidized handset upgrades and other
value-added capabilities.
> Demand for Sophisticated Data Applications
The ongoing development of more sophisticated wireless networks,
devices and applications has created increased data functionality. At
the same time, it has enabled Canadians to access – and demand – an
ever-expanding array of content, from popular apps to high-quality
streaming video, music and television programming. Wireless believes
that the rapid introduction of such new technologies and capabilities
will continue to drive the growth of wireless data services into the
future.
> Convergence of Technologies
Technologies across wireless and wireline platforms have been
increasingly converging over recent years. This convergence has
enabled Wireless to launch new applications for customers, such as an
application where the user can manage their recordings from a
smartphone or a tablet, and a live TV content streaming application
to smartphones and tablets.
> Increased Competition from Other Wireless Operators
Wireless faces intensive competition from incumbent national and
regional wireless operators as well as a number of smaller, relatively
new entrants in the Canadian wireless market. This trend is
elaborated in the “Competition in Our Businesses” section of this
MD&A. Over the past three years, the smaller new entrants have
introduced unlimited usage pricing plans and extremely aggressive
pricing and promotions. This has resulted in downward price
adjustments, particularly for wireless voice services, as well as
increases in customer churn.
> Migration to Next Generation Wireless Technology
Advances in wireless data transmission technologies, combined with
customer demand for more sophisticated wireless services and data
functionality, have led wireless providers to migrate towards the next
generation of broadband wireless data networks, such as LTE and
HSPA+. These networks enable far higher data transmission speeds
with increased efficiency, low latency and enhanced video streaming
capabilities. Additionally, these networks support a variety of
increasingly advanced data applications – among them, broadband
Internet access, multimedia services and seamless access to corporate
information systems, including desktop, client and server-based
applications, on a local, national or international basis. Wireless has
34 ROGERS COMMUNICATIONS INC. 2012 ANNUAL REPORT