Rogers 2012 Annual Report Download - page 103
Download and view the complete annual report
Please find page 103 of the 2012 Rogers annual report below. You can navigate through the pages in the report by either clicking on the pages listed below, or by using the keyword search tool below to find specific information within the annual report.-
 1
1 -
2
-
3
-
4
-
5
-
6
-
7
-
8
-
9
-
10
-
11
-
12
-
13
-
14
-
15
-
16
-
17
-
18
-
19
-
20
-
21
-
22
-
23
-
24
-
25
-
26
-
27
-
28
-
29
-
30
-
31
-
32
-
33
-
34
-
35
-
36
-
37
-
38
-
39
-
40
-
41
-
42
-
43
-
44
-
45
-
46
-
47
-
48
-
49
-
50
-
51
-
52
-
53
-
54
-
55
-
56
-
57
-
58
-
59
-
60
-
61
-
62
-
63
-
64
-
65
-
66
-
67
-
68
-
69
-
70
-
71
-
72
-
73
-
74
-
75
-
76
-
77
-
78
-
79
-
80
-
81
-
82
-
83
-
84
-
85
-
86
-
87
-
88
-
89
-
90
-
91
-
92
-
 93
93 -
 94
94 -
 95
95 -
 96
96 -
 97
97 -
 98
98 -
 99
99 -
 100
100 -
 101
101 -
 102
102 -
 103
103 -
 104
104 -
 105
105 -
 106
106 -
 107
107 -
 108
108 -
 109
109 -
 110
110 -
 111
111 -
 112
112 -
 113
113 -
114
-
115
-
116
-
117
-
118
-
119
-
120
-
121
-
122
 |
 |

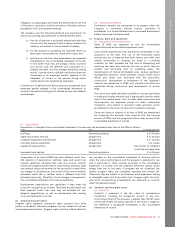
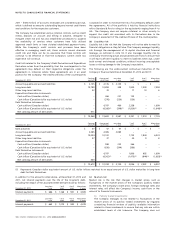
NOTES TO CONSOLIDATED FINANCIAL STATEMENTS
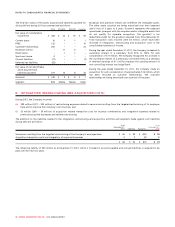
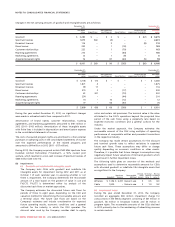
between 3 and 5 years, and computer equipment and software is
amortized on a straight-line basis at rates between 4 and 10 years.
The impact of these changes was accounted for prospectively and
resulted in a decrease of depreciation expense of approximately $90
million in 2012 and also a decrease of approximately $180 million in
fiscal 2013.
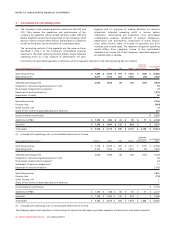
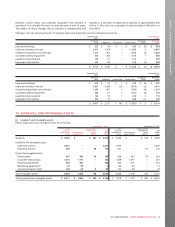
Changes in the net carrying amounts of property, plant and equipment can be summarized as follows:
December 31,
2011 December 31,
2012
Net book
value Additions Acquisitions Depreciation Disposals/
Other Net book
value
Land and buildings $ 635 $ 30 $ – $ (29) $ (2) $ 634
Cable and wireless network 6,401 1,354 – (1,090) 2 6,667
Computer equipment and software 1,216 407 – (293) (2) 1,328
Customer premise equipment 364 255 – (175) 1 445
Leasehold improvements 153 27 – (21) – 159
Equipment and vehicles 345 69 – (70) (1) 343
$ 9,114 $ 2,142 $ – $ (1,678) $ (2) $ 9,576
December 31,
2010 December 31,
2011
Net book
value Additions Acquisitions Depreciation Disposals/
Other Net book
value
Land and buildings $ 618 $ 51 $ 1 $ (29) $ (6) $ 635
Cable and wireless network 5,891 1,354 136 (979) (1) 6,401
Computer equipment and software 1,059 467 3 (309) (4) 1,216
Customer premise equipment 383 171 1 (187) (4) 364
Leasehold improvements 160 12 1 (22) 2 153
Equipment and vehicles 326 72 – (69) 16 345
$ 8,437 $ 2,127 $ 142 $ (1,595) $ 3 $ 9,114
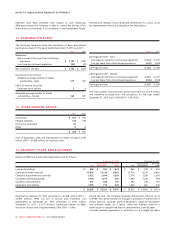
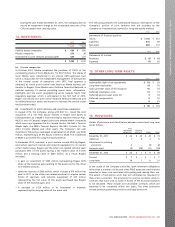
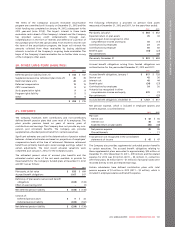
13. GOODWILL AND INTANGIBLE ASSETS
(a) Goodwill and intangible assets:
Details of goodwill and intangible assets are as follows:
December 31, 2012 December 31, 2011
Cost
prior to
impairment
losses Accumulated
amortization
Accumulated
impairment
losses
((b)(ii))
Net
book
value
Cost
prior to
impairment
losses Accumulated
amortization
Accumulated
impairment
losses
((b)(ii))
Net
book
value
Goodwill $ 3,436 $ – $ 221 $ 3,215 $ 3,434 $ – $ 154 $ 3,280
Indefinite life intangible assets:
Spectrum licences 2,231 – – 2,231 1,875 – – 1,875
Broadcast licences 209 – 99 110 207 – 91 116
Finite life intangible assets:
Brand names 437 240 14 183 436 222 14 200
Customer relationships 1,310 1,147 – 163 1,309 1,077 – 232
Roaming agreements 523 357 – 166 523 313 – 210
Marketing agreements 63 59 – 4 62 50 – 12
Acquired program rights 162 63 5 94 132 56 – 76
Total intangible assets 4,935 1,866 118 2,951 4,544 1,718 105 2,721
Total goodwill and intangible assets $ 8,371 $ 1,866 $ 339 $ 6,166 $ 7,978 $ 1,718 $ 259 $ 6,001
2012 ANNUAL REPORT ROGERS COMMUNICATIONS INC. 99