Rogers 2012 Annual Report Download - page 42
Download and view the complete annual report
Please find page 42 of the 2012 Rogers annual report below. You can navigate through the pages in the report by either clicking on the pages listed below, or by using the keyword search tool below to find specific information within the annual report.-
 1
1 -
2
-
3
-
4
-
5
-
6
-
7
-
8
-
9
-
10
-
11
-
12
-
13
-
14
-
15
-
16
-
17
-
18
-
19
-
20
-
21
-
22
-
23
-
24
-
25
-
26
-
27
-
28
-
29
-
30
-
31
-
 32
32 -
 33
33 -
 34
34 -
 35
35 -
 36
36 -
 37
37 -
 38
38 -
 39
39 -
 40
40 -
 41
41 -
 42
42 -
 43
43 -
 44
44 -
 45
45 -
 46
46 -
 47
47 -
 48
48 -
 49
49 -
 50
50 -
 51
51 -
 52
52 -
53
-
54
-
55
-
56
-
57
-
58
-
59
-
60
-
61
-
62
-
63
-
64
-
65
-
66
-
67
-
68
-
69
-
70
-
71
-
72
-
73
-
74
-
75
-
76
-
77
-
78
-
79
-
80
-
81
-
82
-
83
-
84
-
85
-
86
-
87
-
88
-
89
-
90
-
91
-
92
-
93
-
94
-
95
-
96
-
97
-
98
-
99
-
100
-
101
-
102
-
103
-
104
-
105
-
106
-
107
-
108
-
109
-
110
-
111
-
112
-
113
-
114
-
115
-
116
-
117
-
118
-
119
-
120
-
121
-
122
 |
 |

MANAGEMENT’S DISCUSSION AND ANALYSIS
light of customer demand for more sophisticated data applications
and devices.
The modest year-over-year decrease in other operating expenses,
excluding the retention spending increase, was driven by the growth
in the Wireless’ subscriber base. This growth meant higher customer
care costs for serving our expanding postpaid subscriber base and
supporting more sophisticated devices and services, combined with
increased spending on advertising and promotion. However, such
increased expenses were predominately offset by savings related to
strategic cost management and productivity initiatives. Wireless
continues to focus on implementing a program of permanent cost
reduction and efficiency improvement initiatives to control the
overall operating expense structure and derive scale efficiencies across
various functions, in line with our strategy to improve our cost
structure and drive ongoing productivity.
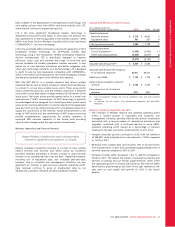
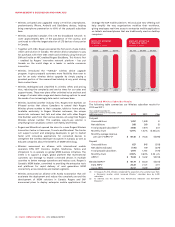
Wireless Adjusted Operating Profit
The 1% year-over-year increase in Wireless’ adjusted operating profit
and the 45.6% adjusted operating profit margin on network revenue
(which excludes equipment sales revenue) for 2012 primarily reflects
the modest increases in network and equipment revenue, partially
offset by an increase in total operating expenses, driven by the record
high volume of smartphone activations and upgrades as discussed in
the preceding section.
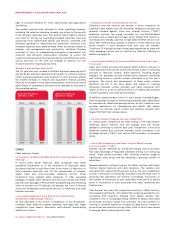
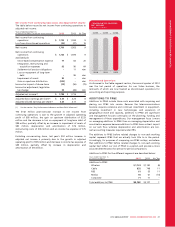
($)
WIRELESS POSTPAID
MONTHLY ARPU
$72.62 $70.26 $69.30
2010 2011 2012
(%)
WIRELESS POSTPAID
MONTHLY CHURN
1.18% 1.32% 1.29%
2010 2011 2012
CABLE
Cable Industry Trends
> Investment in Improved Cable Networks and Expanded Service
Offerings
In recent years, North American cable companies have made
substantial investments in: (i) the installation of fibre-optic cable,
including initiatives to push fibre closer to the home; (ii) electronics in
their respective networks; and (iii) the development of Internet,
digital cable and voice-over-cable telephony services. These
investments have enabled cable companies to offer expanded
packages of digital cable television services (such as VOD and SVOD,
pay television packages, PVR and HDTV programming, and streaming
video to multiple non-TV devices), increasingly fast tiers of Internet
access and widespread home phone services to residential and small
business customers.
> Increased Competition from Alternative Broadcasting
Distribution Undertakings (“BDUs”)
As fully described in the section “Competition in Our Businesses”,
Canadian cable television systems generally face legal and illegal
competition from several alternative multi-channel broadcasting
distribution systems.
> Growth of Internet Protocol-Based Services
Telephony over the Internet has become a direct competitor to
Canadian cable systems and the incumbent telephone providers we
primarily compete against. Voice over Internet Protocol (“VoIP”)
telephony services are being provided by non-facilities-based
providers, such as Skype and Vonage, which market VoIP services to
individuals who already subscribe to high-speed Internet services over
which their VoIP products operate. In addition, certain television and
movie content is more prevalent than ever over the Internet.
Traditional TV viewing has been increasingly augmented by these and
other emerging options such as over-the-top television offerings as
Netflix and Apple TV.
> Increasing Availability of Online and Wireless Access to Cable
TV Content
Cable and content providers throughout North America continue to
create platforms that provide online and wireless access to increasing
amounts of television content. These platforms, including Rogers
Anyplace TV, generally provide authentication features controlling
and limiting access to specific content subscribed to at the user’s
residence. The launch and development of these online content
platforms are still in the early stages and subject to ongoing
discussions between content providers and cable companies with
respect to how to access on-demand versions of traditionally televised
content is granted, controlled and monetized.
In addition, cable providers in the U.S. and Canada, including Rogers,
have increasingly focused on developing streaming video applications
for smartphones, tablets and gaming devices. As well, Cable also now
provides applications for smartphones and tablets that enable
customers to remotely search content and remotely program their
Rogers PVR from their wireless device.
> Facilities-Based Telephony Services Competitors
For several years, competition has been strong in the long distance
telephony service markets, with the average price per minute
generally continuing to decline each year. Competition in the local
telephone market also continues between Cable, Incumbent Local
Exchange Carriers (“ILECs”) and various VoIP providers, as discussed
above.
> Increased Competition from Non-Facilities-Based Internet
Service Providers (“ISPs”)
Internet services delivered by non-facilities-based service providers
that take advantage of regulated wholesale pricing is an increasing
threat. These service providers offer unlimited Internet usage at
significantly lower prices and are attracting a growing number of
subscribers.
Demand generally continues to grow for Cable’s services, particularly
Internet, digital television and cable telephony. The variable costs
associated with supporting this growth, such as the cost of additional
content, commissions for subscriber activations and the fixed costs of
acquiring new subscribers, are material. Accordingly, fluctuations in
the number of activations of new subscribers from period to period
result in fluctuations in costs associated with sales, marketing and
field services.
Over the past two years, the competitive intensity in Cable’s territory
has escalated significantly. This reflects the increasing availability of a
competing IPTV television offering from Cable’s primary ILEC
competitor that is increasingly being offered at deeply discounted
promotional pricing to attract new customers. This has resulted in a
slowing of customer acquisition volumes at Cable and an increase in
promotional and retention pricing offers, both of which have served
to dampen Cable’s revenue growth rates.
38 ROGERS COMMUNICATIONS INC. 2012 ANNUAL REPORT