Rogers 2012 Annual Report Download - page 37
Download and view the complete annual report
Please find page 37 of the 2012 Rogers annual report below. You can navigate through the pages in the report by either clicking on the pages listed below, or by using the keyword search tool below to find specific information within the annual report.-
 1
1 -
2
-
3
-
4
-
5
-
6
-
7
-
8
-
9
-
10
-
11
-
12
-
13
-
14
-
15
-
16
-
17
-
18
-
19
-
20
-
21
-
22
-
23
-
24
-
25
-
26
-
 27
27 -
 28
28 -
 29
29 -
 30
30 -
 31
31 -
 32
32 -
 33
33 -
 34
34 -
 35
35 -
 36
36 -
 37
37 -
 38
38 -
 39
39 -
 40
40 -
 41
41 -
 42
42 -
 43
43 -
 44
44 -
 45
45 -
 46
46 -
 47
47 -
48
-
49
-
50
-
51
-
52
-
53
-
54
-
55
-
56
-
57
-
58
-
59
-
60
-
61
-
62
-
63
-
64
-
65
-
66
-
67
-
68
-
69
-
70
-
71
-
72
-
73
-
74
-
75
-
76
-
77
-
78
-
79
-
80
-
81
-
82
-
83
-
84
-
85
-
86
-
87
-
88
-
89
-
90
-
91
-
92
-
93
-
94
-
95
-
96
-
97
-
98
-
99
-
100
-
101
-
102
-
103
-
104
-
105
-
106
-
107
-
108
-
109
-
110
-
111
-
112
-
113
-
114
-
115
-
116
-
117
-
118
-
119
-
120
-
121
-
122
 |
 |

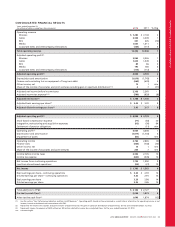
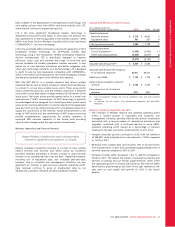
MANAGEMENT’S DISCUSSION AND ANALYSIS
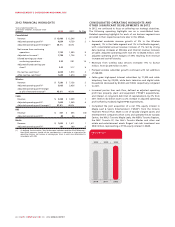
CONSOLIDATED FINANCIAL RESULTS
Years ended December 31,
(In millions of dollars, except per share amounts) 2012 2011 % Chg
Operating revenue
Wireless $ 7,280 $ 7,138 2
Cable 3,358 3,309 1
RBS 351 405 (13)
Media 1,620 1,611 1
Corporate items and intercompany eliminations (123) (117) 5
Total operating revenue 12,486 12,346 1
Adjusted operating profit(1)
Wireless 3,063 3,036 1
Cable 1,605 1,549 4
RBS 89 86 3
Media 190 180 6
Corporate items and intercompany eliminations (113) (112) 1
Adjusted operating profit(1) 4,834 4,739 2
Depreciation and amortization (1,819) (1,743) 4
Finance costs excluding loss on repayment of long-term debt (664) (639) 4
Other income, net 15 1 n/m
Share of the income of associates and joint ventures excluding gain on spectrum distribution(1)(2) 27 (71)
Adjusted net income before income taxes 2,368 2,365 –
Adjusted income tax expense(1)(3) (580) (629) (8)
Adjusted net income(1) $ 1,788 $ 1,736 3
Adjusted basic earnings per share(1) $ 3.45 $ 3.20 8
Adjusted diluted earnings per share(1) 3.43 3.17 8
Adjusted operating profit(1) $ 4,834 $ 4,739 2
Stock-based compensation expense (77) (64) 20
Integration, restructuring and acquisition expenses (92) (56) 64
Settlement of pension obligations –(11) n/m
Operating profit(1) 4,665 4,608 1
Depreciation and amortization (1,819) (1,743) 4
Impairment of assets (80) – n/m
Operating income 2,766 2,865 (3)
Finance costs (664) (738) (10)
Other income, net 15 1 n/m
Share of the income of associates and joint ventures 235 7 n/m
Income before income taxes 2,352 2,135 10
Income tax expense (620) (545) 14
Net income from continuing operations 1,732 1,590 9
Loss from discontinued operations (32) (27) 19
Net income $ 1,700 $ 1,563 9
Basic earnings per share – continuing operations $ 3.34 $ 2.93 14
Diluted earnings per share – continuing operations 3.32 2.91 14
Basic earnings per share 3.28 2.88 14
Diluted earnings per share 3.26 2.86 14
Total additions to PP&E $ 2,142 $ 2,127 1
Pre-tax free cash flow(1) 2,029 1,973 3
After-tax free cash flow(1) 1,649 1,874 (12)
(1) See the section “Key Performance Indicators and Non-GAAP Measures”. Operating profit should not be considered as a substitute or alternative for operating income or net
income, in each case determined in accordance with IFRS.
(2) Represents the income of associates and joint ventures of $235 million less the gain on spectrum distribution of $233 million, for the year ended December 31, 2012.
(3) Represents income tax expense of $620 million less $40 million related to income tax on adjusted items, for the year ended December 31, 2012.
nm: not meaningful.
2012 ANNUAL REPORT ROGERS COMMUNICATIONS INC. 33