Rogers 2012 Annual Report Download - page 28
Download and view the complete annual report
Please find page 28 of the 2012 Rogers annual report below. You can navigate through the pages in the report by either clicking on the pages listed below, or by using the keyword search tool below to find specific information within the annual report.-
 1
1 -
2
-
3
-
4
-
5
-
6
-
7
-
8
-
9
-
10
-
11
-
12
-
13
-
14
-
15
-
16
-
17
-
 18
18 -
 19
19 -
 20
20 -
 21
21 -
 22
22 -
 23
23 -
 24
24 -
 25
25 -
 26
26 -
 27
27 -
 28
28 -
 29
29 -
 30
30 -
 31
31 -
 32
32 -
 33
33 -
 34
34 -
 35
35 -
 36
36 -
 37
37 -
 38
38 -
39
-
40
-
41
-
42
-
43
-
44
-
45
-
46
-
47
-
48
-
49
-
50
-
51
-
52
-
53
-
54
-
55
-
56
-
57
-
58
-
59
-
60
-
61
-
62
-
63
-
64
-
65
-
66
-
67
-
68
-
69
-
70
-
71
-
72
-
73
-
74
-
75
-
76
-
77
-
78
-
79
-
80
-
81
-
82
-
83
-
84
-
85
-
86
-
87
-
88
-
89
-
90
-
91
-
92
-
93
-
94
-
95
-
96
-
97
-
98
-
99
-
100
-
101
-
102
-
103
-
104
-
105
-
106
-
107
-
108
-
109
-
110
-
111
-
112
-
113
-
114
-
115
-
116
-
117
-
118
-
119
-
120
-
121
-
122
 |
 |

MANAGEMENT’S DISCUSSION AND ANALYSIS
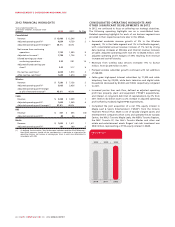
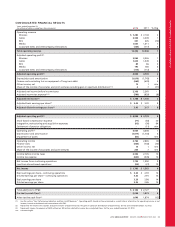
2012 FINANCIAL HIGHLIGHTS
Years ended December 31,
(In millions of dollars, except per share
amounts) 2012 2011 % Chg
Consolidated
Revenue $ 12,486 $ 12,346 1
Adjusted operating profit(1) 4,834 4,739 2
Adjusted operating profit margin(1) 38.7% 38.4%
Net income from continuing
operations 1,732 1,590 9
Adjusted net income(1) 1,788 1,736 3
Diluted earnings per share -
continuing operations 3.32 2.91 14
Adjusted diluted earnings per
share(1) 3.43 3.17 8
Pre-tax free cash flow(1) 2,029 1,973 3
After-tax free cash flow(1) 1,649 1,874 (12)
Wireless
Revenue $ 7,280 $ 7,138 2
Adjusted operating profit(1) 3,063 3,036 1
Adjusted operating profit margin
as a% of network revenue(1) 45.6% 46.0%
Cable
Revenue $ 3,358 $ 3,309 1
Adjusted operating profit(1) 1,605 1,549 4
Adjusted operating profit margin(1) 47.8% 46.8%
RBS
Revenue $ 351 $ 405 (13)
Adjusted operating profit(1) 89 86 3
Media
Revenue $ 1,620 $ 1,611 1
Adjusted operating profit(1) 190 180 6
(1) As defined. See the section “Key Performance Indicators and Non-GAAP Measures”.
Non-GAAP measures should not be considered as a substitute or alternative for
operating income, net income or earnings per share in each case determined in
accordance with IFRS.
CONSOLIDATED OPERATING HIGHLIGHTS AND
OTHER SIGNIFICANT DEVELOPMENTS IN 2012
In 2012, we continued to focus on achieving our strategic objectives.
The following operating highlights are on a consolidated basis.
Detailed operating highlights for each of our business segments are
provided in their respective sections later in this MD&A.
• Generated moderate revenue growth of 2% in the Wireless
segment, 1% in the Cable segment and 1% in the Media segment,
with consolidated annual revenue increase of 1% led by strong
data revenue increases at Wireless and Internet revenue increases
at Cable. Adjusted operating profit rose 2% to $4,834 million, with
adjusted operating profit margins of 39% resulting from revenue
increase and cost efficiencies.
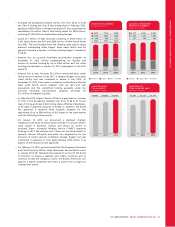
• Revenues from wireless data services increased 17% to $2,722
million, from $2,325 million in 2011.
• Postpaid wireless subscriber growth continued with net additions
of 268,000.
• Cable grew high-speed Internet subscribers by 71,000 and cable
telephony lines by 22,000, while basic television and digital cable
households decreased by 83,000 and 9,000, respectively compared
to 2011.
• Increased pre-tax free cash flow, defined as adjusted operating
profit less property, plant and equipment (“PP&E”) expenditures,
and interest on long-term debt (net of capitalization), by 3% from
2011 levels to $2 billion due to a 2% increase in adjusted operating
profit offset by modestly higher PP&E expenditures.
• Completed the joint acquisition of a net 75% equity interest in
Maple Leaf & Sports Entertainment (“MLSE”) from the Ontario
Teachers’ Pension Plan. MLSE is one of Canada’s largest sports and
entertainment companies which owns and operates the Air Canada
Centre, the NHL’s Toronto Maple Leafs, the NBA’s Toronto Raptors,
the MLS’ Toronto FC, the AHL’s Toronto Marlies and other real
estate and entertainment assets. Rogers’ net cash investment was
$540 million, representing a 37.5% equity interest in MLSE.
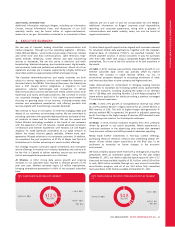
($)
ADJUSTED EPS
$2.96 $3.20 $3.45
2010 2011 2012
24 ROGERS COMMUNICATIONS INC. 2012 ANNUAL REPORT