Rogers 2004 Annual Report Download - page 78
Download and view the complete annual report
Please find page 78 of the 2004 Rogers annual report below. You can navigate through the pages in the report by either clicking on the pages listed below, or by using the keyword search tool below to find specific information within the annual report.-
 1
1 -
2
-
3
-
4
-
5
-
6
-
7
-
8
-
9
-
10
-
11
-
12
-
13
-
14
-
15
-
16
-
17
-
18
-
19
-
20
-
21
-
22
-
23
-
24
-
25
-
26
-
27
-
28
-
29
-
30
-
31
-
32
-
33
-
34
-
35
-
36
-
37
-
38
-
39
-
40
-
41
-
42
-
43
-
44
-
45
-
46
-
47
-
48
-
49
-
50
-
51
-
52
-
53
-
54
-
55
-
56
-
57
-
58
-
59
-
60
-
61
-
62
-
63
-
64
-
65
-
66
-
67
-
 68
68 -
 69
69 -
 70
70 -
 71
71 -
 72
72 -
 73
73 -
 74
74 -
 75
75 -
 76
76 -
 77
77 -
 78
78 -
 79
79 -
 80
80 -
 81
81 -
 82
82 -
 83
83 -
 84
84 -
 85
85 -
 86
86 -
 87
87 -
 88
88 -
89
-
90
-
91
-
92
-
93
-
94
-
95
-
96
-
97
-
98
-
99
-
100
-
101
-
102
-
103
-
104
-
105
-
106
-
107
-
108
-
109
-
110
-
111
-
112
-
113
-
114
-
115
-
116
 |
 |

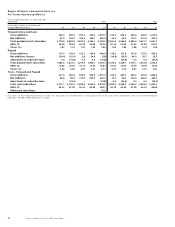
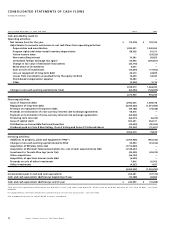
76 Rogers Communications Inc. 2004 Annual Report
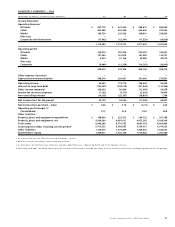
CONSOLIDATED STATEMENTS OF CASH FLOWS
(In thousands of dollars)
Years ended December 31, 2004 and 2003 2004 2003
Cash provided by (used in):
Operating activities:
Net income (loss) for the year $ (13,218) $ 129,193
Adjustments to reconcile net income to net cash flows from operating activities:
Depreciation and amortization 1,092,551 1,040,263
Program rights and video rental inventory depreciation 88,328 81,271
Future income taxes – (24,532)
Non-controlling interest 79,581 58,425
Unrealized foreign exchange loss (gain) 66,943 (290,661)
Change in fair value of derivative instruments (26,774) –
Write-down of investments 6,021 –
Gain on sale of investments (14,454) (17,902)
Loss on repayment of long-term debt 28,210 24,839
Losses from investments accounted for by the equity method 18,694 54,033
Stock-based compensation expense 15,389 –
Other (3,252) 9,114
1,338,019 1,064,043
Change in non-cash working capital (note 10(a)) (62,090) (128,699)
1,275,929 935,344
Financing activities:
Issue of long-term debt 8,982,443 1,589,518
Repayment of long-term debt (6,043,533) (1,691,480)
Premium on repayment of long-term debt (49,188) (19,348)
Proceeds on termination of cross-currency interest rate exchange agreements 58,416 –
Payment on termination of cross-currency interest rate exchange agreements (64,602) –
Financing costs incurred (66,071) (6,220)
Issue of capital stock 302,231 252,011
Distribution on Convertible Preferred Securities (33,000) (33,000)
Dividends paid on Class B Non-Voting, Class A Voting and Series E Preferred shares (23,422) (11,607)
3,063,274 79,874
Investing activities:
Additions to property, plant and equipment (“PP&E”) (1,054,938) (963,742)
Change in non-cash working capital related to PP&E 59,994 (81,416)
Acquisition of Wireless (note 3(a)) (1,772,840) –
Acquisition of Microcell Telecommunications Inc., net of cash acquired (note 3(b)) (1,148,637) –
Investment in Toronto Blue Jays (note 7(a)) (99,235) (29,374)
Other acquisitions (66,700) –
Acquisition of spectrum licences (note 6(b)) (6,055) –
Proceeds on sale of other investments 7,816 20,705
Other investments (4,327) 1,437
(4,084,922) (1,052,390)
Increase (decrease) in cash and cash equivalents 254,281 (37,172)
Cash and cash equivalents (deficiency), beginning of year (10,288) 26,884
Cash and cash equivalents (deficiency), end of year $ 243,993 $ (10,288)
Cash and cash equivalents (deficiency) are defined as cash and short-term deposits, which have an original maturity of less than 90 days, less bank
advances.
For supplemental cash flow information and disclosure of non-cash transactions, see note 10(b).
See accompanying notes to consolidated financial statements