Rogers 2004 Annual Report Download - page 73
Download and view the complete annual report
Please find page 73 of the 2004 Rogers annual report below. You can navigate through the pages in the report by either clicking on the pages listed below, or by using the keyword search tool below to find specific information within the annual report.-
 1
1 -
2
-
3
-
4
-
5
-
6
-
7
-
8
-
9
-
10
-
11
-
12
-
13
-
14
-
15
-
16
-
17
-
18
-
19
-
20
-
21
-
22
-
23
-
24
-
25
-
26
-
27
-
28
-
29
-
30
-
31
-
32
-
33
-
34
-
35
-
36
-
37
-
38
-
39
-
40
-
41
-
42
-
43
-
44
-
45
-
46
-
47
-
48
-
49
-
50
-
51
-
52
-
53
-
54
-
55
-
56
-
57
-
58
-
59
-
60
-
61
-
62
-
 63
63 -
 64
64 -
 65
65 -
 66
66 -
 67
67 -
 68
68 -
 69
69 -
 70
70 -
 71
71 -
 72
72 -
 73
73 -
 74
74 -
 75
75 -
 76
76 -
 77
77 -
 78
78 -
 79
79 -
 80
80 -
 81
81 -
 82
82 -
 83
83 -
84
-
85
-
86
-
87
-
88
-
89
-
90
-
91
-
92
-
93
-
94
-
95
-
96
-
97
-
98
-
99
-
100
-
101
-
102
-
103
-
104
-
105
-
106
-
107
-
108
-
109
-
110
-
111
-
112
-
113
-
114
-
115
-
116
 |
 |

71
Rogers Communications Inc. 2004 Annual Report
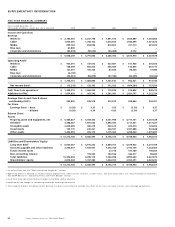
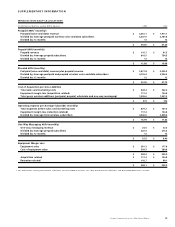
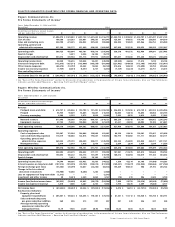
SELECTED UNAUDITED QUARTERLY PRO FORMA FINANCIAL AND OPERATING DATA
Rogers Communications Inc.
Pro Forma Statements of Income1
Years Ended December 31, 2004 and 2003
Unaudited 2004 2003
(In millions of dollars, except margin
and per subscriber statistics) Q1 Q2 Q3 Q4 FY Q1 Q2 Q3 Q4 FY
Operating revenue $ 1,406,078 $ 1,501,883 $ 1,607,134 $ 1,641,620 $ 6,156,715 $ 1,245,722 $ 1,309,492 $ 1,354,707 $ 1,441,207 $ 5,351,128
Cost of sales 160,268 221,283 253,861 246,535 881,947 125,307 160,652 179,746 228,605 694,310
Sales and marketing costs 224,790 221,425 236,053 307,620 989,888 224,302 193,929 201,966 256,752 876,949
Operating, general and
administrative expenses 631,296 596,172 631,440 630,956 2,489,862 557,834 553,139 550,535 590,959 2,252,467
Operating profit 389,725 463,004 485,781 456,510 1,795,018 338,278 401,772 422,460 364,891 1,527,402
Special charges – 5,441 4,226 26,106 35,773 – – – – –
Depreciation and amortization 337,674 341,944 351,716 377,912 1,409,247 367,837 355,288 351,246 363,872 1,438,244
Operating income (loss) 52,050 115,618 129,838 52,491 349,998 (29,559) 46,484 71,215 1,019 89,158
Interest on long-term debt (172,875) (167,571) (165,090) (195,534) (701,069) (221,402) (194,459) (172,106) (165,445) (753,411)
Other income (expense) (83,678) (51,797) 28,243 15,083 (92,149) 212,826 144,234 (13,490) 54,794 398,365
Income tax recovery (expense) (1,939) (4,041) (5,357) 4,727 (6,610) (7,729) (12,272) (4,277) 44,751 20,473
Non-controlling interest – – ––––––––
Net income (loss) for the period $ (206,442) $ (107,791) $ (12,366) $ (123,232) $ (449,830) $ (45,864) $ (16,012) $ (118,658) $ (64,882) $ (245,415)
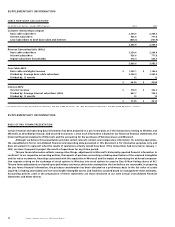
1 See “Basis of Pro Forma Presentation” section for discussion of considerations in the preparation of this pro forma information. Also see “Key Performance
Indicators and Non-GAAP Measures – Operating Profit and Profit Margin” section.
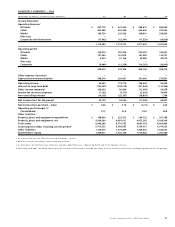
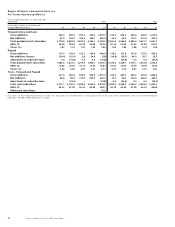
Rogers Wireless Communications Inc.
Pro Forma Statements of Income1
Years Ended December 31, 2004 and 2003
Unaudited 2004 2003
(In millions of dollars,except margin
and per subscriber statistics) Q1 Q2 Q3 Q4 FY Q1 Q2 Q3 Q4 FY
Revenue
Postpaid (voice and data) $ 616,727 $ 676,846 $ 734,700 $ 741,492 $ 2,769,765 $ 526,804 $ 557,458 $ 610,129 $ 602,555 $ 2,296,946
Prepaid 53,935 55,829 53,865 52,847 216,476 52,003 54,814 53,853 60,064 220,735
One-way messaging 6,386 6,293 5,973 5,828 24,480 7,432 6,876 6,815 6,442 27,565
Network revenue 677,048 738,968 794,538 800,167 3,010,721 586,239 619,148 670,797 669,062 2,545,245
Equipment revenue 57,122 75,340 100,044 88,764 321,270 41,221 49,593 60,902 70,105 221,821
Total operating revenue 734,170 814,308 894,582 888,931 3,331,991 627,460 668,741 731,699 739,167 2,767,067
Operating expenses
Cost of equipment sales 122,607 151,364 184,806 166,884 625,661 84,336 99,618 120,281 175,461 479,696
Sales and marketing expenses 114,519 118,888 122,018 193,647 549,072 102,975 103,002 111,711 146,483 464,171
Operating, general and
administrative expenses 269,533 279,759 288,389 308,311 1,145,990 255,333 252,009 255,058 254,721 1,017,121
Management fees 2,919 2,919 2,918 2,919 11,675 2,834 2,834 2,834 2,834 11,336
Total operating expenses 509,578 552,930 598,131 671,761 2,332,398 445,478 457,463 489,884 579,499 1,972,324
Operating profit 224,593 261,379 296,452 217,171 999,593 181,981 211,278 241,815 159,668 794,743
Depreciation and amortization 150,053 155,272 156,774 157,499 619,598 180,612 166,064 160,619 177,166 684,462
Special charges – 5,441 4,226 26,106 35,773 – – – – –
Operating income (loss) 74,540 100,666 135,452 33,566 344,222 1,369 45,214 81,196 (17,498) 110,281
Interest expense on long-term debt (107,515) (101,595) (99,789) (108,912) (417,810) (149,291) (119,477) (102,928) (100,066) (471,762)
Foreign exchange gain (loss) (31,664) (41,299) 10,837 (22,246) (84,372) 155,449 100,572 508 29,192 285,722
Change in the fair value of
derivative instruments (18,900) 15,060 (5,206) 1,246 (7,800) – – – – –
Loss on repayment of long-term debt (2,313) – – – (2,313) – – – – –
Investment and other income 30 (1,481) 2,549 2,069 3,167 (78) 419 906 2,503 3,750
Income (loss) before income taxes (85,822) (28,649) 43,843 (94,278) (164,906) 7,449 26,728 (20,318) (85,868) (72,009)
Income tax expense (recovery) 1,810 1,808 3,287 2,745 9,650 1,975 10,278 2,409 (9,885) 4,777
Net income (loss) $ (87,632) $ (30,457) $ 40,556 $ (97,023) $ (174,556) $ 5,474 $ 16,451 $ (22,727) $ (75,983) $ (76,785)
Key Business Indicators:
Property, plant and
equipment expenditures $ 205,867 $ 169,624 $ 128,458 $ 170,185 $ 674,134 $ 81,381 $ 111,112 $ 136,520 $ 155,738 $ 484,751
Sales and marketing costs
per gross subscriber addition 360 358 315 391 357 381 349 326 347 348
Average monthly operating
expense per subscriber after
management fees 18.79 19.45 20.39 20.90 19.88 18.63 18.55 18.71 18.65 18.61
1 See “Basis of Pro Forma Presentation” section for discussion of considerations in the preparation of this pro forma information. Also see “Key Performance
Indicators and Non-GAAP Measures – Operating Profit and Profit Margin” section.