Rogers 2004 Annual Report Download - page 77
Download and view the complete annual report
Please find page 77 of the 2004 Rogers annual report below. You can navigate through the pages in the report by either clicking on the pages listed below, or by using the keyword search tool below to find specific information within the annual report.-
 1
1 -
2
-
3
-
4
-
5
-
6
-
7
-
8
-
9
-
10
-
11
-
12
-
13
-
14
-
15
-
16
-
17
-
18
-
19
-
20
-
21
-
22
-
23
-
24
-
25
-
26
-
27
-
28
-
29
-
30
-
31
-
32
-
33
-
34
-
35
-
36
-
37
-
38
-
39
-
40
-
41
-
42
-
43
-
44
-
45
-
46
-
47
-
48
-
49
-
50
-
51
-
52
-
53
-
54
-
55
-
56
-
57
-
58
-
59
-
60
-
61
-
62
-
63
-
64
-
65
-
66
-
 67
67 -
 68
68 -
 69
69 -
 70
70 -
 71
71 -
 72
72 -
 73
73 -
 74
74 -
 75
75 -
 76
76 -
 77
77 -
 78
78 -
 79
79 -
 80
80 -
 81
81 -
 82
82 -
 83
83 -
 84
84 -
 85
85 -
 86
86 -
 87
87 -
88
-
89
-
90
-
91
-
92
-
93
-
94
-
95
-
96
-
97
-
98
-
99
-
100
-
101
-
102
-
103
-
104
-
105
-
106
-
107
-
108
-
109
-
110
-
111
-
112
-
113
-
114
-
115
-
116
 |
 |

75
Rogers Communications Inc. 2004 Annual Report
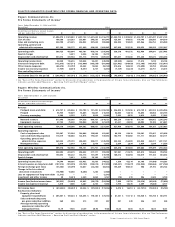
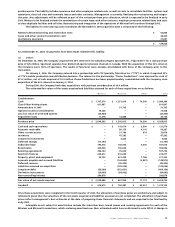
Years ended December 31, 2004 and 2003 2004 2003
Operating revenue $ 5,608,249 $ 4,791,856
Cost of sales 797,857 642,243
Sales and marketing expenses 883,622 742,781
Operating, general and administrative expenses 2,192,629 1,957,936
Depreciation and amortization 1,092,551 1,040,263
Operating income 641,590 408,633
Interest on long-term debt 522,074 488,865
119,516 (80,232)
Gain on sale of investments 14,454 17,902
Write-down of investments (6,021) –
Losses from investments accounted for by the equity method (18,694) (54,033)
Loss on repayment of long-term debt (note 11(e)) (28,210) (24,839)
Foreign exchange gain (loss) (note 2(g)) (67,555) 303,707
Change in the fair value of derivative instruments 26,774 –
Gain on dilution on issue of shares by a subsidiary 15,502 1,977
Investment and other income, net 14,044 279
Income before income taxes and non-controlling interest 69,810 164,761
Income tax expense (reduction) (note 14):
Current 3,447 1,675
Future – (24,532)
3,447 (22,857)
Income before non-controlling interest 66,363 187,618
Non-controlling interest (79,581) (58,425)
Net income (loss) for the year $ (13,218) $ 129,193
Earnings (loss) per share (note 15):
Basic $ (0.28) $ 0.35
Diluted (0.28) 0.34
See accompanying notes to consolidated financial statements.
CONSOLIDATED STATEMENTS OF DEFICIT
(In thousands of dollars)
Years ended December 31, 2004 and 2003 2004 2003
Deficit, beginning of year:
As previously reported $ (339,436) $ (415,589)
Change in accounting policy related to stock-based compensation (note 2(p)) (7,025) –
As restated (346,461) (415,589)
Net income (loss) for the year (13,218) 129,193
Dividends on Class A Voting and Class B Non-Voting shares (24,052) (23,238)
Dividends on Series E Preferred shares – (11)
Distribution on Convertible Preferred Securities, net of income taxes of $3,209 in 2003 (note 13(b)) (33,000) (29,791)
Deficit, end of year $ (416,731) $ (339,436)
See accompanying notes to consolidated financial statements.
CONSOLIDATED STATEMENTS OF INCOME
(In thousands of dollars, except per share amounts)