Rogers 2004 Annual Report Download - page 74
Download and view the complete annual report
Please find page 74 of the 2004 Rogers annual report below. You can navigate through the pages in the report by either clicking on the pages listed below, or by using the keyword search tool below to find specific information within the annual report.-
 1
1 -
2
-
3
-
4
-
5
-
6
-
7
-
8
-
9
-
10
-
11
-
12
-
13
-
14
-
15
-
16
-
17
-
18
-
19
-
20
-
21
-
22
-
23
-
24
-
25
-
26
-
27
-
28
-
29
-
30
-
31
-
32
-
33
-
34
-
35
-
36
-
37
-
38
-
39
-
40
-
41
-
42
-
43
-
44
-
45
-
46
-
47
-
48
-
49
-
50
-
51
-
52
-
53
-
54
-
55
-
56
-
57
-
58
-
59
-
60
-
61
-
62
-
63
-
 64
64 -
 65
65 -
 66
66 -
 67
67 -
 68
68 -
 69
69 -
 70
70 -
 71
71 -
 72
72 -
 73
73 -
 74
74 -
 75
75 -
 76
76 -
 77
77 -
 78
78 -
 79
79 -
 80
80 -
 81
81 -
 82
82 -
 83
83 -
 84
84 -
85
-
86
-
87
-
88
-
89
-
90
-
91
-
92
-
93
-
94
-
95
-
96
-
97
-
98
-
99
-
100
-
101
-
102
-
103
-
104
-
105
-
106
-
107
-
108
-
109
-
110
-
111
-
112
-
113
-
114
-
115
-
116
 |
 |

72 Rogers Communications Inc. 2004 Annual Report
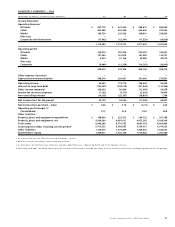
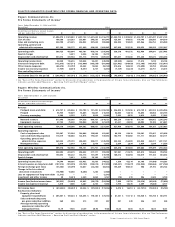
Rogers Wireless Communications Inc.
Pro Forma Operating Metrics1
Years Ended December 31, 2004 and 2003
Unaudited 2004 2003
(Subscriber statistics in thousands
except ARPU and churn) Q1 Q2 Q3 Q4 FY Q1 Q2 Q3 Q4 FY
Postpaid (Voice and Data)
Gross additions 302.2 350.0 397.2 444.4 1,493.7 213.9 243.4 296.4 460.9 1,214.6
Net additions 97.0 134.2 166.6 208.1 605.9 30.2 65.4 110.5 241.3 447.3
Total postpaid retail subscribers 3,718.8 3,852.9 4,019.5 4,184.1 4,184.1 3,204.6 3,269.9 3,380.4 3,621.7 3,621.7
ARPU ($) 56.00 59.64 62.33 60.86 59.74 55.16 57.45 61.26 57.80 57.87
Churn (%) 1.87 1.91 1.97 1.95 1.93 1.93 1.84 1.88 2.14 1.95
Prepaid
Gross additions 115.3 109.4 123.7 149.6 498.0 119.2 137.8 161.8 175.0 593.9
Net additions (losses) (30.4) (35.0) 6.8 54.8 (3.8) (19.8) (29.3) 46.0 38.7 35.5
Adjustment to subscriber base 0.0 (74.8) 0.0 0.0 (74.8) – (20.9) 0.0 0.0 (20.9)
Total prepaid retail subscribers 1,382.3 1,272.5 1,279.3 1,334.1 1,334.1 1,378.3 1,328.1 1,374.1 1,412.8 1,412.8
ARPU ($) 12.82 14.25 14.12 13.62 13.67 12.47 13.57 13.29 14.49 13.43
Churn (%) 3.45 3.65 3.07 2.47 3.17 3.32 4.12 2.87 3.31 3.41
Total – Postpaid and Prepaid
Gross additions 417.4 459.4 520.9 593.9 1,991.7 333.2 381.2 458.2 635.9 1,808.4
Net additions 66.6 99.2 173.3 262.9 602.1 10.3 36.0 156.5 280.0 482.9
Adjustment to subscriber base – (74.8) – – (74.8) 0.0 (20.9) 0.0 0.0 (20.9)
Total retail subscribers 5,101.1 5,125.5 5,298.8 5,518.2 5,518.2 4,582.9 4,598.0 4,754.5 5,034.5 5,034.5
ARPU ($) 44.07 47.99 50.54 49.45 48.01 42.18 44.55 47.38 45.47 44.86
Wholesale subscribers 91.2
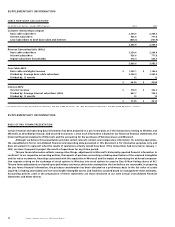
1 See “Basis of Pro Forma Presentation” section for discussion of considerations in the preparation of this pro forma information. Also see “Key Performance
Indicators and Non-GAAP Measures” section.