Rogers 2004 Annual Report Download - page 48
Download and view the complete annual report
Please find page 48 of the 2004 Rogers annual report below. You can navigate through the pages in the report by either clicking on the pages listed below, or by using the keyword search tool below to find specific information within the annual report.-
 1
1 -
2
-
3
-
4
-
5
-
6
-
7
-
8
-
9
-
10
-
11
-
12
-
13
-
14
-
15
-
16
-
17
-
18
-
19
-
20
-
21
-
22
-
23
-
24
-
25
-
26
-
27
-
28
-
29
-
30
-
31
-
32
-
33
-
34
-
35
-
36
-
37
-
 38
38 -
 39
39 -
 40
40 -
 41
41 -
 42
42 -
 43
43 -
 44
44 -
 45
45 -
 46
46 -
 47
47 -
 48
48 -
 49
49 -
 50
50 -
 51
51 -
 52
52 -
 53
53 -
 54
54 -
 55
55 -
 56
56 -
 57
57 -
 58
58 -
59
-
60
-
61
-
62
-
63
-
64
-
65
-
66
-
67
-
68
-
69
-
70
-
71
-
72
-
73
-
74
-
75
-
76
-
77
-
78
-
79
-
80
-
81
-
82
-
83
-
84
-
85
-
86
-
87
-
88
-
89
-
90
-
91
-
92
-
93
-
94
-
95
-
96
-
97
-
98
-
99
-
100
-
101
-
102
-
103
-
104
-
105
-
106
-
107
-
108
-
109
-
110
-
111
-
112
-
113
-
114
-
115
-
116
 |
 |

46 Rogers Communications Inc. 2004 Annual Report
FINANCING AND RISK MANAGEMENT
CONSOLIDATED LIQUIDITY AND CAPITAL RESOURCES
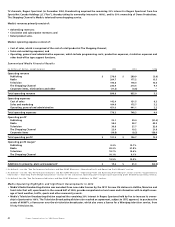
Operations
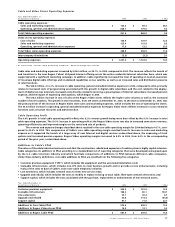
In 2004, cash generated from operations before changes in non-cash operating items, which is calculated by adjusting to remove the
effect of all non-cash items from net income, increased to $1,338.0 million, from $1,064.0 million in 2003. The $274.0 million increase is
primarily the result of the increase in operating profit of $285.3 million.
Taking into account the changes in non-cash working capital items for 2004, cash generated from operations was $1,275.9 million,
compared to $935.3 million in the previous year.
Cash flow from operations of $1,275.9 million, together with the following items, resulted in total net funds of approximately
$6,366.4 million raised in 2004:
• Aggregate proceeds of $4,788.3 million from nine debt issues described in the following “Financing and Risk Management:
Consolidated Liquidity and Capital Resources – Financing” section; and
• Net equity proceeds of $302.2 million, of which $238.9 million was received from a “bought deal” equity issue of Class B Non-Voting
shares and the remaining $63.3 million was received from the issuance of Class B Non-Voting shares under employee share purchase
plans and the exercise of employee stock options.
Net funds used during 2004 totalled approximately $6,112.0 million, the details of which include:
• The redemption/repayment of an aggregate principal amount of $1,605.3 million of long-term debt comprised of the redemption of
four debt issues and the repayment of all of Microcell’s outstanding bank debt, as more fully described in the following “Financing”
section;
• The $1,772.8 million acquisition of the 34% stake in Wireless owned by AWE, including related fees and expenses paid;
• The acquisition of Microcell for $1,148.6 million, net of cash acquired;
• Additions to PP&E of $994.9 million, net of $60.0 million changes in non-cash working capital;
• The net repayment of $237.5 million of advances under bank credit facilities;
• The acquisition of 20% of the Blue Jays from Labatt’s for $39.1 million and the redemption of Blue Jays Holdco Class A Preferred
shares held by RTL for $30.0 million;
• Other acquisitions of $66.7 million, the largest of which was Media’s acquisition of the 20% minority interest in Sportsnet for
$45.0 million;
• Financing costs incurred of $66.1 million;
• Premiums on the early repayment of long-term debt aggregating $49.2 million;
• Distributions on Convertible Preferred Securities of $33.0 million;
• Payment of dividends of $23.4 million on Class B Non-Voting shares, Class A Voting shares and Series E Preferred shares;
• Other investment net, aggregating $26.7 million; and
• An aggregate of $18.7 million for various items, comprised of $6.1 million for the acquisition of spectrum, $6.2 million net cost for
the termination of certain cross-currency interest rate exchange agreements and a $6.6 million net reduction in capital leases and
mortgage obligations.
Taking into account the cash deficiency of $10.3 million at the beginning of the year, the cash on hand at the end of the year was
$244.0 million.
In 2005, Cable expects total additions to PP&E of between $590 million and $690 million, of which approximately $110 million to
$130 million will be directly associated with the deployment of cable telephony. The expected additions to PP&E at Cable, excluding
those directly related to cable telephony, primarily relate to the purchase and placement of CPE associated with new digital and
Internet subscribers and scaleable infrastructure to expand the capacity and improve the performance of Cable’s network.
In 2005, Wireless expects total additions to PP&E, excluding additions to PP&E associated with the integration of Microcell or
potential expenditures associated with the development or deployment of fixed wireless initiatives, to be between $475 million and
$500 million.
Financing
Our long-term debt instruments are described in Note 11 to the Consolidated Financial Statements.
In February 2004, RWI completed a debt issuance in an aggregate principal amount of US$750.0 million 6.375% Senior Secured
Notes due 2014, and on March 26, 2004, used approximately US$734.7 million of the proceeds to redeem US$196.1 million 8.30% Senior
Secured Notes due 2007, US$179.1 million 8.80% Senior Subordinated Notes due 2007, and US$333.2 million 9.375% Senior Secured
Debentures due 2008. Also in February 2004, Wireless unwound an aggregate of US$333.2 million notional amount of cross-currency
interest rate exchange agreements for net cash proceeds of $58.4 million. In February 2004, Wireless also entered into US$750 million
notional amount of new cross-currency interest rate exchange agreements.
As a result of these transactions, Wireless recorded a loss on repayment of $2.3 million, which included redemption premiums of
$34.7 million and the write-off of deferred financing costs of $7.8 million, offset by a $40.2 million gain on the release of the deferred
transitional gain related to the cross-currency interest rate exchange agreements that were unwound during the first quarter of 2004.
The cross-currency interest exchange agreements were previously treated as effective hedges for accounting purposes prior to the
adoption of the new rules with respect to accounting for hedges, as discussed in Note 2 to the Consolidated Financial Statements.