Rogers 2004 Annual Report Download - page 38
Download and view the complete annual report
Please find page 38 of the 2004 Rogers annual report below. You can navigate through the pages in the report by either clicking on the pages listed below, or by using the keyword search tool below to find specific information within the annual report.-
 1
1 -
2
-
3
-
4
-
5
-
6
-
7
-
8
-
9
-
10
-
11
-
12
-
13
-
14
-
15
-
16
-
17
-
18
-
19
-
20
-
21
-
22
-
23
-
24
-
25
-
26
-
27
-
 28
28 -
 29
29 -
 30
30 -
 31
31 -
 32
32 -
 33
33 -
 34
34 -
 35
35 -
 36
36 -
 37
37 -
 38
38 -
 39
39 -
 40
40 -
 41
41 -
 42
42 -
 43
43 -
 44
44 -
 45
45 -
 46
46 -
 47
47 -
 48
48 -
49
-
50
-
51
-
52
-
53
-
54
-
55
-
56
-
57
-
58
-
59
-
60
-
61
-
62
-
63
-
64
-
65
-
66
-
67
-
68
-
69
-
70
-
71
-
72
-
73
-
74
-
75
-
76
-
77
-
78
-
79
-
80
-
81
-
82
-
83
-
84
-
85
-
86
-
87
-
88
-
89
-
90
-
91
-
92
-
93
-
94
-
95
-
96
-
97
-
98
-
99
-
100
-
101
-
102
-
103
-
104
-
105
-
106
-
107
-
108
-
109
-
110
-
111
-
112
-
113
-
114
-
115
-
116
 |
 |

36 Rogers Communications Inc. 2004 Annual Report
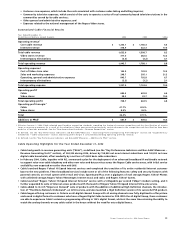
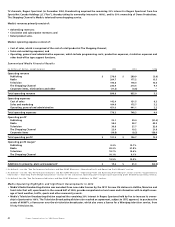
Cable Revenue and Subscribers
Year Ended December 31,
(Subscriber statistics in thousands, except ARPU) 2004 2003 %Chg
Homes passed 3,291.1 3,215.4 2.4
Customer relationships12,355.9 2,339.3 0.7
Customer relationships, net additions116.6 19.7 (15.7)
Revenue generating units13,866.7 3,582.5 7.9
Revenue generating units, net additions1284.2 282.1 0.7
Basic cable subscribers 2,254.6 2,269.4 (0.7)
Basic cable, net additions (losses) (14.8) (0.9) –
Core cable ARPU2$ 46.29 $ 43.69 6.0
Internet subscribers3936.6 777.8 20.4
Internet, net additions3158.8 149.3 6.4
Internet ARPU2$ 37.25 $ 38.14 (2.3)
Digital terminals in service 795.7 613.6 29.7
Digital terminals, net additions 182.1 157.5 15.6
Digital households 675.4 535.3 26.2
Digital households, net additions 140.1 133.8 4.7
1 As defined – See the “Key Performance Indicators and Non-GAAP Measures – Subscriber Counts, Customer Relationships, and Revenue Generating Units” sections.
2 As defined – See the “Key Performance Indicators and Non-GAAP Measures – Average Revenue per Subscriber” section.
3 Effective in the third quarter of 2004, Cable modified the reporting of Internet subscribers to include only those subscribers with service installed, operating
and on billing and to exclude those subscribers who have subscribed to the service but installation of the service was still pending. Historically, Cable had
included both those subscribers that had the service installed and those with installations pending. Prior period results for Internet subscribers and net
additions have been conformed to this current presentation.
Core Cable Revenue
Core cable revenue, which accounted for 64.4% of total revenues in 2004, totalled $1,253.1 million, a $66.7 million or 5.6% increase over
2003. Analog cable service increased year-over-year by $33.3 million due to price increases in August 2003 and July 2004, with the
remaining $33.4 million increase primarily attributable to increased penetration of its incremental digital only cable services such as
VOD, premium pay, specialty channels and ethnic programming.
The increase in core cable ARPU to $46.29 from $43.69 reflects the growing penetration of Cable’s digital products, its continued
up-selling of customers into incremental programming packages and pricing changes in July 2004 and August 2003.
The popularity of the bundled offerings and the Rogers VIP customer loyalty program has continued. Cable estimates that
approximately 1.1 million customers now subscribe to two or more Cable, Internet and Wireless services and it expects this trend to
continue as it continues to develop and advertise unique product bundles. During the fourth quarter of 2004, Cable introduced a flexi-
ble new approach to bundling, the Rogers Better Choice Bundles, that replaced the Rogers Incredible Bundles, which had been
introduced in May 2002.
Internet Revenue
The growth of $56.6 million, or 17.6%, in Internet revenue primarily reflects the 20.4% increase in the number of Internet subscribers.
Average monthly revenue per Internet subscriber for 2004 was $37.25, a decrease from $38.14 in 2003, due to increased promotional
activity as well as an increase in the proportion of subscribers to Cable’s lower priced entry level Internet offerings. Year-over-year, the
Internet subscriber base has grown by 158,800, resulting in 28.5% Internet penetration as a percentage of homes passed.
Video Stores Revenue
The $34.4 million, or 12.2%, increase in Rogers Video stores revenue reflects the combination of a 7.2% increase in same store revenues
and an increase in the number of stores at December 31, 2004, to 294 compared to 279 at December 31, 2003. “Same stores” are stores,
that were open for a full year in both 2004 and 2003. The strong Rogers Video store sales results, as compared to 2003, are attributable
to an increase in the number of popular titles that were available in the year and higher average revenue per customer visit. At the end
of 2004, many of the Rogers Video stores were integrated stores that offered access to a wide variety of cable, Internet and Rogers
Wireless products and services, in addition to the core DVD and video rental and sales offerings.