Rogers 2004 Annual Report Download - page 23
Download and view the complete annual report
Please find page 23 of the 2004 Rogers annual report below. You can navigate through the pages in the report by either clicking on the pages listed below, or by using the keyword search tool below to find specific information within the annual report.-
 1
1 -
2
-
3
-
4
-
5
-
6
-
7
-
8
-
9
-
10
-
11
-
12
-
 13
13 -
 14
14 -
 15
15 -
 16
16 -
 17
17 -
 18
18 -
 19
19 -
 20
20 -
 21
21 -
 22
22 -
 23
23 -
 24
24 -
 25
25 -
 26
26 -
 27
27 -
 28
28 -
 29
29 -
 30
30 -
 31
31 -
 32
32 -
 33
33 -
34
-
35
-
36
-
37
-
38
-
39
-
40
-
41
-
42
-
43
-
44
-
45
-
46
-
47
-
48
-
49
-
50
-
51
-
52
-
53
-
54
-
55
-
56
-
57
-
58
-
59
-
60
-
61
-
62
-
63
-
64
-
65
-
66
-
67
-
68
-
69
-
70
-
71
-
72
-
73
-
74
-
75
-
76
-
77
-
78
-
79
-
80
-
81
-
82
-
83
-
84
-
85
-
86
-
87
-
88
-
89
-
90
-
91
-
92
-
93
-
94
-
95
-
96
-
97
-
98
-
99
-
100
-
101
-
102
-
103
-
104
-
105
-
106
-
107
-
108
-
109
-
110
-
111
-
112
-
113
-
114
-
115
-
116
 |
 |

21
Rogers Communications Inc. 2004 Annual Report
We measure the success of our strategies using a number of key performance indicators as outlined in the section “Key
Performance Indicators and Non-GAAP Measures”. These key performance indicators are not measurements in accordance with
Canadian or U.S. GAAP and should not be considered as an alternative to net income or any other measure of performance under
Canadian or U.S. GAAP.
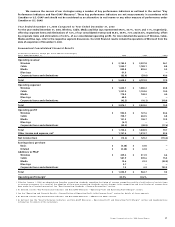
Year Ended December 31, 2004 Compared to Year Ended December 31, 2003
For the year ended December 31, 2004, Wireless, Cable, Media and Blue Jays represented 49.6%, 34.7%, 16.0% and 1.1%, respectively,
offset by corporate items and eliminations of 1.4%, of our consolidated revenue and 54.8%, 40.9%, 7.0% and (0.4)%, respectively, offset
by corporate items and eliminations of (2.3)%, of our consolidated operating profit. For more detailed discussions of Wireless, Cable,
Media and Blue Jays, refer to the respective segment discussions. Our 2004 financial results include the operations of Microcell from the
date of acquisition of November 9, 2004.
Summarized Consolidated Financial Results
(In millions of dollars, except per share amounts and margin)
Years Ended December 31, 2004 2003 %Chg
Operating revenue1
Wireless $ 2,783.5 $ 2,207.8 26.1
Cable 1,945.7 1,788.1 8.8
Media 899.8 855.0 5.2
Blue Jays 61.9 – –
Corporate items and eliminations (82.6) (59.0) 40.0
Total $ 5,608.3 $ 4,791.9 17.0
Operating expenses1
Wireless $ 1,833.1 $ 1,480.2 23.8
Cable 1,237.0 1,124.6 10.0
Media 778.3 748.3 4.0
Blue Jays 68.0 – –
Corporate items and eliminations (42.3) (10.1) 318.8
Total $ 3,874.1 $ 3,343.0 15.9
Operating profit2
Wireless $ 950.4 $ 727.6 30.6
Cable 708.7 663.5 6.8
Media 121.5 106.7 13.9
Blue Jays (6.1) – –
Corporate items and eliminations (40.3) (48.9) (17.6)
Total $ 1,734.2 $ 1,448.9 19.7
Other income and expense, net31,747.4 1,319.7 32.4
Net income (loss) $ (13.2) $ 129.2 (110.2)
Earnings (loss) per share
Basic $ (0.28) $ 0.35 –
Diluted $ (0.28) $ 0.34 –
Additions to PP&E4
Wireless $ 439.2 $ 411.9 6.6
Cable 587.9 509.6 15.4
Media 19.6 41.3 (52.5)
Blue Jays 0.7 – –
Corporate items and eliminations 7.5 0.9 733.3
Total $ 1,054.9 $ 963.7 9.5
Operating profit margin530.9% 30.2%
1 Effective January 1, 2004, we adopted new Canadian accounting standards regarding the timing of revenue recognition and the classification of certain items
as revenue or expense. As a result of the adoption of these new accounting standards, certain changes to the recognition and classification of revenue have
been made for all periods presented. See “New Accounting Standards – Revenue Recognition” section.
2 As defined. See the “Key Performance Indicators and Non-GAAP Measures – Operating Profit and Operating Profit Margin” section.
3 See the “Operating and Financial Results – Reconciliation of Operating Profit to Net Income (Loss)” section for details of these amounts.
4 As defined. See the “Key Performance Indicators and Non-GAAP Measures – Additions to PP&E” section.
5 As defined. See the “Key Performance Indicators and Non-GAAP Measures – Operating Profit and Operating Profit Margin” section and Supplementary
Information for details of the calculation.