Rogers 2004 Annual Report Download - page 100
Download and view the complete annual report
Please find page 100 of the 2004 Rogers annual report below. You can navigate through the pages in the report by either clicking on the pages listed below, or by using the keyword search tool below to find specific information within the annual report.-
 1
1 -
2
-
3
-
4
-
5
-
6
-
7
-
8
-
9
-
10
-
11
-
12
-
13
-
14
-
15
-
16
-
17
-
18
-
19
-
20
-
21
-
22
-
23
-
24
-
25
-
26
-
27
-
28
-
29
-
30
-
31
-
32
-
33
-
34
-
35
-
36
-
37
-
38
-
39
-
40
-
41
-
42
-
43
-
44
-
45
-
46
-
47
-
48
-
49
-
50
-
51
-
52
-
53
-
54
-
55
-
56
-
57
-
58
-
59
-
60
-
61
-
62
-
63
-
64
-
65
-
66
-
67
-
68
-
69
-
70
-
71
-
72
-
73
-
74
-
75
-
76
-
77
-
78
-
79
-
80
-
81
-
82
-
83
-
84
-
85
-
86
-
87
-
88
-
89
-
 90
90 -
 91
91 -
 92
92 -
 93
93 -
 94
94 -
 95
95 -
 96
96 -
 97
97 -
 98
98 -
 99
99 -
 100
100 -
 101
101 -
 102
102 -
 103
103 -
 104
104 -
 105
105 -
 106
106 -
 107
107 -
 108
108 -
 109
109 -
 110
110 -
111
-
112
-
113
-
114
-
115
-
116
 |
 |

98 Rogers Communications Inc. 2004 Annual Report
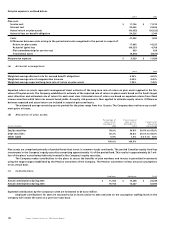
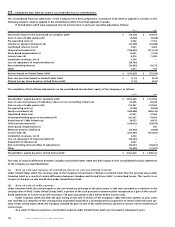
Total income tax expense (reduction) varies from the amounts that would be computed by applying the statutory income tax rate to
income before income taxes for the following reasons:
2004 2003
Statutory income tax rate 35.3% 36.6%
Income tax expense on income before income taxes and non-controlling interest $ 24,643 $ 60,302
Increase (decrease) in income taxes resulting from:
Change in the valuation allowance for future income tax assets (25,089) 46,267
Adjustments to future income tax assets and liabilities for changes in substantively enacted rates (920) (70,502)
Non-taxable portion of capital gains (2,391) (9,610)
Non-deductible (non-taxable) foreign exchange on debt and other items 2,491 (46,954)
Recovery of prior years’ income taxes (6,660) (9,206)
Non-deductible portion of losses from investments accounted for by the equity method 3,715 10,514
Other items (2,563) (14,549)
Large Corporations Tax 10,221 10,881
Income tax expense (reduction) $ 3,447 $ (22,857)
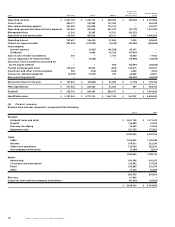
As at December 31, 2004, the Company has the following non-capital income tax losses available to reduce future years’ income for
income tax purposes:
Income tax losses expiring in the year ending December 31:
2005 $ 419,034
2006 316,932
2007 649,487
2008 998,161
2009 219,965
2010 159,654
2011 675,392
2012 25,000
$ 3,463,625
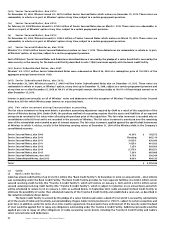
15. EARNINGS (LOSS) PER SHARE:
The following table sets forth the calculation of basic and diluted earnings (loss) per share:
2004 2003
Numerator:
Net income (loss) for the year $ (13,218) $ 129,193
Distribution on Convertible Preferred
Securities, net of income taxes (33,000) (29,791)
Dividends accreted on Convertible Preferred Securities (20,924) (20,033)
Dividends on Series E Preferred shares – (11)
Basic earnings (loss) for the year (67,142) 79,358
Effect of dilutive securities:
Dividends on Series E Preferred shares –11
Diluted earnings (loss) for the year $ (67,142) $ 79,369
Denominator (in thousands):
Weighted average number of shares outstanding – basic 240,435 225,918
Effect of dilutive securities:
Employee stock options – 3,565
Series E Preferred shares – 126
Other – 825
Weighted average number of shares outstanding – diluted 240,435 230,434
Earnings (loss) per share:
Basic $ (0.28) $ 0.35
Diluted (0.28) 0.34