Rogers 2004 Annual Report Download - page 30
Download and view the complete annual report
Please find page 30 of the 2004 Rogers annual report below. You can navigate through the pages in the report by either clicking on the pages listed below, or by using the keyword search tool below to find specific information within the annual report.-
 1
1 -
2
-
3
-
4
-
5
-
6
-
7
-
8
-
9
-
10
-
11
-
12
-
13
-
14
-
15
-
16
-
17
-
18
-
19
-
 20
20 -
 21
21 -
 22
22 -
 23
23 -
 24
24 -
 25
25 -
 26
26 -
 27
27 -
 28
28 -
 29
29 -
 30
30 -
 31
31 -
 32
32 -
 33
33 -
 34
34 -
 35
35 -
 36
36 -
 37
37 -
 38
38 -
 39
39 -
 40
40 -
41
-
42
-
43
-
44
-
45
-
46
-
47
-
48
-
49
-
50
-
51
-
52
-
53
-
54
-
55
-
56
-
57
-
58
-
59
-
60
-
61
-
62
-
63
-
64
-
65
-
66
-
67
-
68
-
69
-
70
-
71
-
72
-
73
-
74
-
75
-
76
-
77
-
78
-
79
-
80
-
81
-
82
-
83
-
84
-
85
-
86
-
87
-
88
-
89
-
90
-
91
-
92
-
93
-
94
-
95
-
96
-
97
-
98
-
99
-
100
-
101
-
102
-
103
-
104
-
105
-
106
-
107
-
108
-
109
-
110
-
111
-
112
-
113
-
114
-
115
-
116
 |
 |

28 Rogers Communications Inc. 2004 Annual Report
and marketing resources focused towards Wireless’ prepaid offerings given its postpaid focus, combined with highly-competitive pre-
paid offerings in the market.
One-way messaging (paging) subscriber churn has declined year-over-year to 2.78%, while one-way messaging ARPU has
increased by 10.1%, reflecting pricing changes implemented in earlier periods. With 196,100 paging subscribers, Wireless continues to
view paging as a profitable but mature business and recognizes that churn will likely continue at relatively high rates as one-way
messaging subscribers increasingly migrate to two-way messaging and converged voice and data services.
Wireless Equipment Sales
In 2004, revenue from wireless voice, data and messaging equipment sales, including activation fees and net of equipment subsidies,
was $281.2 million, up $103.4 million, or 58.2%, from 2003. This significant increase in equipment revenue reflects the higher volume of
handset upgrades associated with its retention programs, combined with the generally higher price points of more sophisticated hand-
sets and devices and the higher volume of postpaid voice and data subscriber gross additions.
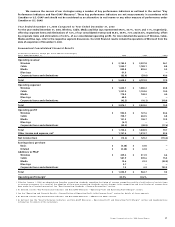
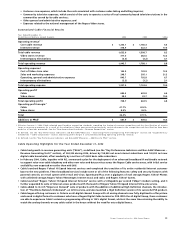
Wireless Operating Expenses
(In millions of dollars,except per subscriber statistics)
Years Ended December 31, 2004 2003 %Chg
Operating expenses1
Cost of equipment sales $ 509.6 $ 380.8 33.8
Sales and marketing expenses 444.4 362.0 22.8
Operating, general and administrative expenses 879.1 737.4 19.2
Total operating expenses $ 1,833.1 $ 1,480.2 23.8
Average monthly operating expenses per subscriber
before sales and marketing expenses1$ 18.99 $ 17.62 7.8
Sales and marketing costs per gross subscriber addition1$ 372 $ 376 (1.1)
1 As reclassified. See the “New Accounting Standards – Revenue Recognition” section.
The $128.8 million increase for 2004 in the cost of equipment sales reflects the significantly increased handset upgrade activity associated
with Wireless’ retention programs and increased activations of new subscribers. Both the new subscriber acquisition and subscriber
retention programs were influenced by the trend to higher-priced feature-rich colour handsets and data devices.
The 22.8% year-over-year increase in total sales and marketing expenses primarily reflects the higher variable acquisition costs
associated with the 13.7% year-over-year increase in the number of postpaid voice and data gross additions in 2004, as compared to
2003, and the acquisition of Microcell. Variable sales and marketing expenses increased in line with Wireless’ strategy of offering
customers incentives to enter into multi-year service contracts. Fixed sales and marketing costs, such as advertising and overhead costs,
increased modestly in 2004, as compared to the prior year, largely due to increased advertising costs. Sales and marketing costs per
gross addition was $372, a decrease of $4 from $376 in 2003.
The year-over-year increase in operating, general and administrative expenses of $141.7 million, or 19.2%, as compared to the
corresponding period in 2003, is primarily attributable to the acquisition of Microcell, higher credit and collection costs, increases in net-
work operating expense and growth in customer service and retention expenses reflective of the growth in Wireless’ customer base.
Retention spending includes the cost of customer loyalty and renewal programs, as well as residual payments to third-party agents and
distributors for ongoing service for certain existing customers. This increase is partially offset by savings related to more favourable
roaming cost arrangements and operating efficiencies across various functions.
The year-over-year increase in average monthly operating expense per subscriber, excluding sales and marketing expenses, to
$18.99 in 2004 reflects Wireless’ increased spending on handset upgrades associated with targeted retention programs and the impact
of increases in operating, general and administrative expenses. Total retention spending (including subsidies on handset upgrades)
increased to $88.4 million in 2004, as compared to $75.7 million in 2003. Retention spending, both on an absolute and per subscriber
basis, is expected to continue to grow as wireless market penetration in Canada increases.
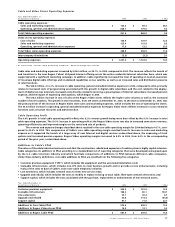
Wireless Operating Profit
Operating profit grew by $222.8 million, or 30.6%, to $950.4 million in 2004, from $727.6 million in 2003. Operating profit as a percentage
of network revenue, or operating profit margin, increased to 38.0% in 2004, from 35.8% in 2003 due to the strength of network revenue
growth.
Additions to Wireless’ PP&E
Additions to PP&E totalled $439.2 million in 2004, an increase of $27.3 million, or 6.6%, from $411.9 million in 2003. Additions to network-
related PP&E were $347.8 million, compared to $339.8 million in the prior year, and included $195.8 million for capacity expansion of the
GSM/GPRS/EDGE network and transmission, compared to $222.4 million in 2003. The balance of $152.0 million in additions to network-
related PP&E related primarily to technical upgrade projects, including new cell sites, operational support systems and the addition of
new services. Other additions to PP&E consisted of $66.9 million for information technology initiatives and $24.5 million for other facili-
ties and equipment.
Wireless Employees
Remuneration represents a material portion of Wireless’ expenses. It ended 2004 with approximately 4,975 full-time equivalent (“FTE”)
and 312 contract equivalent (“CE”) employees, an increase of 2,611 and 188 respectively, from December 31, 2003. The increase in the FTE