Rogers 2004 Annual Report Download - page 66
Download and view the complete annual report
Please find page 66 of the 2004 Rogers annual report below. You can navigate through the pages in the report by either clicking on the pages listed below, or by using the keyword search tool below to find specific information within the annual report.-
 1
1 -
2
-
3
-
4
-
5
-
6
-
7
-
8
-
9
-
10
-
11
-
12
-
13
-
14
-
15
-
16
-
17
-
18
-
19
-
20
-
21
-
22
-
23
-
24
-
25
-
26
-
27
-
28
-
29
-
30
-
31
-
32
-
33
-
34
-
35
-
36
-
37
-
38
-
39
-
40
-
41
-
42
-
43
-
44
-
45
-
46
-
47
-
48
-
49
-
50
-
51
-
52
-
53
-
54
-
55
-
 56
56 -
 57
57 -
 58
58 -
 59
59 -
 60
60 -
 61
61 -
 62
62 -
 63
63 -
 64
64 -
 65
65 -
 66
66 -
 67
67 -
 68
68 -
 69
69 -
 70
70 -
 71
71 -
 72
72 -
 73
73 -
 74
74 -
 75
75 -
 76
76 -
77
-
78
-
79
-
80
-
81
-
82
-
83
-
84
-
85
-
86
-
87
-
88
-
89
-
90
-
91
-
92
-
93
-
94
-
95
-
96
-
97
-
98
-
99
-
100
-
101
-
102
-
103
-
104
-
105
-
106
-
107
-
108
-
109
-
110
-
111
-
112
-
113
-
114
-
115
-
116
 |
 |

64 Rogers Communications Inc. 2004 Annual Report
SUPPLEMENTARY INFORMATION
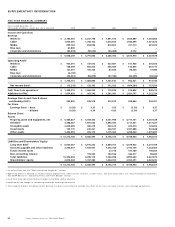
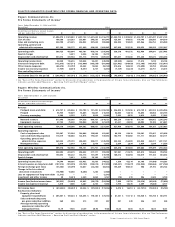
FIVE-YEAR FINANCIAL SUMMARY
Years ended December 31,
(thousands of dollars, except per share amounts) 2004 2003 2002 2001 2000
Income and Cash Flow
Revenue
Wireless1$ 2,783,525 $ 2,207,794 $ 1,891,514 $ 1,640,889 $ 1,544,883
Cable11,945,655 1,788,122 1,614,554 1,446,599 1,301,672
Media 899,763 854,992 810,805 721,710 681,023
Blue Jays 61,849 ––––
Corporate and eliminations (82,543) (59,052) (50,088) 4,772 –
$ 5,608,249 $ 4,791,856 $ 4,266,785 $ 3,813,970 $ 3,527,578
Operating Profit2
Wireless $ 950,391 $ 727,572 $ 527,687 $ 411,945 $ 410,924
Cable 708,659 663,474 563,480 516,805 457,777
Media 121,541 106,724 87,635 68,306 77,390
Blue Jays (6,169) ––––
Corporate and eliminations (40,281) (48,874) (37,188) (44,535) (28,366)
$ 1,734,141 $ 1,448,896 $ 1,141,614 $ 952,521 $ 917,725
Net Income (loss)4$ (13,218) $ 129,193 $ 312,032 $ (464,361) $ 127,520
Cash flow from operations3$ 1,338,019 $ 1,064,043 $ 715,839 $ 516,862 $ 809,214
Additions to PP&E $ 1,054,938 $ 963,742 $ 1,261,983 $ 1,420,747 $ 1,212,734
Average Class A and Class B shares
outstanding (000’s) 240,435 225,918 213,570 208,644 203,761
Per Share
Earnings (loss) – basic $ (0.28) $ 0.35 $ 1.05 $ (2.56) $ 0.37
– diluted (0.28) 0.34 0.83 (2.56) 0.37
Balance Sheet
Assets
Property, plant and equipment, net $ 5,486,837 $ 5,039,304 $ 5,051,998 $ 4,717,731 $ 4,047,329
Goodwill 3,388,687 1,891,636 1,892,060 1,711,551 1,477,227
Intangible assets 2,855,689 400,219 423,674 423,374 124,206
Investments 139,170 229,221 223,937 1,047,888 972,648
Other assets 1,402,355 905,115 1,115,064 1,298,400 1,370,697
$ 13,272,738 $ 8,465,495 $ 8,706,733 $ 9,198,944 $ 7,992,107
Liabilities and Shareholders’ Equity
Long-term debt5$ 8,050,387 $ 4,970,232 $ 5,869,701 $ 5,378,922 $ 4,201,169
Accounts payable and other liabilities 2,346,307 1,534,541 1,272,745 1,192,165 1,232,463
Future income taxes – – 27,716 137,189 145,560
Non-controlling interest – 193,342 132,536 186,377 88,683
Total liabilities 10,396,694 6,698,115 7,302,698 6,894,653 5,667,875
Shareholders’ equity 2,876,044 1,767,380 1,404,035 2,304,291 2,324,232
$ 13,272,738 $ 8,465,495 $ 8,706,733 $ 9,198,944 $ 7,992,107
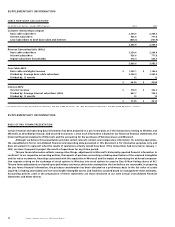
1 As reclassified. See the “New Accounting Standards” section.
2 Operating profit is defined as income before depreciation, amortization, interest, income taxes, non-operating items. See “Key Performance Indicators
Non-GAAP Measures – Operating Profit and Profit Margin” section.
3 Cash flow from operations before changes in working capital amounts.
4 Restated for the change in accounting of foreign exchange translation.
5 Total long-term debt, including current portion, has been reclassified to exclude the effect of our cross-currency interest rate exchange agreements.