Rogers 2004 Annual Report Download - page 68
Download and view the complete annual report
Please find page 68 of the 2004 Rogers annual report below. You can navigate through the pages in the report by either clicking on the pages listed below, or by using the keyword search tool below to find specific information within the annual report.-
 1
1 -
2
-
3
-
4
-
5
-
6
-
7
-
8
-
9
-
10
-
11
-
12
-
13
-
14
-
15
-
16
-
17
-
18
-
19
-
20
-
21
-
22
-
23
-
24
-
25
-
26
-
27
-
28
-
29
-
30
-
31
-
32
-
33
-
34
-
35
-
36
-
37
-
38
-
39
-
40
-
41
-
42
-
43
-
44
-
45
-
46
-
47
-
48
-
49
-
50
-
51
-
52
-
53
-
54
-
55
-
56
-
57
-
 58
58 -
 59
59 -
 60
60 -
 61
61 -
 62
62 -
 63
63 -
 64
64 -
 65
65 -
 66
66 -
 67
67 -
 68
68 -
 69
69 -
 70
70 -
 71
71 -
 72
72 -
 73
73 -
 74
74 -
 75
75 -
 76
76 -
 77
77 -
 78
78 -
79
-
80
-
81
-
82
-
83
-
84
-
85
-
86
-
87
-
88
-
89
-
90
-
91
-
92
-
93
-
94
-
95
-
96
-
97
-
98
-
99
-
100
-
101
-
102
-
103
-
104
-
105
-
106
-
107
-
108
-
109
-
110
-
111
-
112
-
113
-
114
-
115
-
116
 |
 |

66 Rogers Communications Inc. 2004 Annual Report
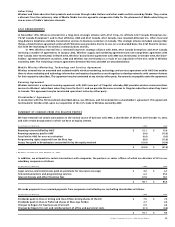
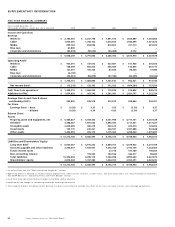
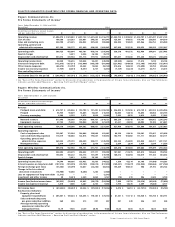
QUARTERLY SUMMARY – 2004
(thousands of dollars, except per share amounts) Q1 Q2 Q3 Q4
Income Statement
Operating Revenue1
Wireless2$ 592,841 $ 655,920 $ 721,136 $ 813,628
Cable 473,074 474,846 489,371 508,364
Media 215,741 230,881 206,757 246,384
Blue Jays – – 42,062 19,787
Corporate and eliminations (16,907) (18,152) (25,638) (21,846)
1,264,749 1,343,495 1,433,688 1,566,317
Operating profit3
Wireless 219,644 247,083 269,565 214,099
Cable 171,186 173,294 173,143 191,036
Media 6,470 38,819 24,046 52,206
Blue Jays – – (9,065) 2,896
Corporate (15,443) (13,407) (1,714) (9,717)
381,857 445,789 455,975 450,520
Other expense (recovery) ––––
Depreciation and amortization 246,090 250,528 255,857 340,076
Operating income 135,767 195,261 200,118 110,444
Interest on long-term debt (124,144) (118,840) (116,359) (162,731)
Other income (expense) (75,383) (41,775) 29,676 37,776
Income tax recovery (expense) (1,453) (3,555) (3,371) 4,932
Non-controlling interest 423 (25,596) (48,480) (5,928)
Net income (loss) for the period (64,790) 5,495 61,584 (15,507)
Net income (loss) per share – basic $ (0.33) $ (0.03) $ 0.20 $ (0.12)
Operating profit margin %3
Consolidated 30.2 33.2 31.8 28.8
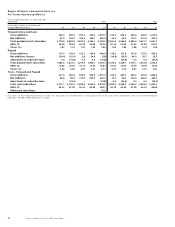
Other Statistics
Property, plant and equipment expenditures $ 228,666 $ 218,267 $ 221,147 $ 386,858
Property, plant and equipment, net 5,037,873 5,016,443 5,007,141 5,486,837
Total assets 8,606,593 8,761,089 8,779,097 13,272,738
Total long-term debt, including current portion45,227,235 5,180,968 4,844,642 8,050,387
Other liabilities 1,471,188 1,402,842 1,646,105 2,346,307
Shareholders’ equity 1,708,771 1,946,787 2,006,238 2,876,044
1 As reclassified, see the “New Accounting Standards” section.
2 Wireless revenue restated to reflect roaming revenue.
3 As defined in “Key Performance Indicators Non-GAAP Measures – Operating Profit and Profit Margin” section.
4 Total long-term debt, including current portion, has been reclassified to exclude the effect of cross-currency interest rate exchange agreements for all periods.