Rogers 2004 Annual Report Download - page 104
Download and view the complete annual report
Please find page 104 of the 2004 Rogers annual report below. You can navigate through the pages in the report by either clicking on the pages listed below, or by using the keyword search tool below to find specific information within the annual report.-
 1
1 -
2
-
3
-
4
-
5
-
6
-
7
-
8
-
9
-
10
-
11
-
12
-
13
-
14
-
15
-
16
-
17
-
18
-
19
-
20
-
21
-
22
-
23
-
24
-
25
-
26
-
27
-
28
-
29
-
30
-
31
-
32
-
33
-
34
-
35
-
36
-
37
-
38
-
39
-
40
-
41
-
42
-
43
-
44
-
45
-
46
-
47
-
48
-
49
-
50
-
51
-
52
-
53
-
54
-
55
-
56
-
57
-
58
-
59
-
60
-
61
-
62
-
63
-
64
-
65
-
66
-
67
-
68
-
69
-
70
-
71
-
72
-
73
-
74
-
75
-
76
-
77
-
78
-
79
-
80
-
81
-
82
-
83
-
84
-
85
-
86
-
87
-
88
-
89
-
90
-
91
-
92
-
93
-
 94
94 -
 95
95 -
 96
96 -
 97
97 -
 98
98 -
 99
99 -
 100
100 -
 101
101 -
 102
102 -
 103
103 -
 104
104 -
 105
105 -
 106
106 -
 107
107 -
 108
108 -
 109
109 -
 110
110 -
 111
111 -
 112
112 -
 113
113 -
 114
114 -
115
-
116
 |
 |

102 Rogers Communications Inc. 2004 Annual Report
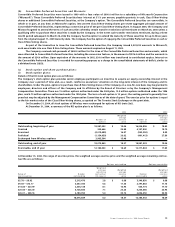
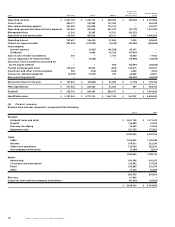
Corporate
items and Consolidated
2003 Wireless Cable Media eliminations Total
Operating revenue $ 2,207,794 $ 1,788,122 $ 854,992 $ (59,052) $ 4,791,856
Cost of sales 380,771 129,938 131,534 – 642,243
Sales and marketing expenses 361,998 205,068 175,715 – 742,781
Operating, general and administrative expenses 737,453 789,642 441,019 (10,178) 1,957,936
Management fees 11,336 35,385 12,551 (59,272) –
Depreciation and amortization 518,599 482,050 36,311 3,303 1,040,263
Operating income 197,637 146,039 57,862 7,095 408,633
Interest on long-term debt (193,506) (237,803) (8,296) (49,260) (488,865)
Intercompany:
Interest expense – (2,867) (46,380) 49,247 –
Dividends – 4,488 43,325 (47,813) –
Gain on sale of other investments 305 – 1,107 16,490 17,902
Loss on repayment of long-term debt – (5,945) – (18,894) (24,839)
Gain (loss) from investments accounted for
by the equity method – – 964 (54,997) (54,033)
Foreign exchange gain (loss) 135,242 49,302 (852) 120,015 303,707
Investment and other income (expense) 556 (516) (464) 2,680 2,256
Income tax reduction (expense) (2,393) (7,541) 703 32,088 22,857
Non-controlling interest – – – (58,425) (58,425)
Net income (loss) for the year $ 137,841 $ (54,843) $ 47,969 $ (1,774) $ 129,193
PP&E expenditures $ 411,933 $ 509,562 $ 41,266 $ 981 $ 963,742
Goodwill $ 378,719 $ 926,445 $ 586,472 $ – $ 1,891,636
Identifiable assets $ 3,107,343 $ 3,727,216 $ 1,467,149 $ 163,787 $ 8,465,495
(b) Product revenue:
Revenue from external customers is comprised of the following:
2004 2003
Wireless:
Postpaid (voice and data) $ 2,361,128 $ 1,911,073
Prepaid 116,658 91,255
One-way messaging 24,480 27,565
Equipment sales 281,259 177,901
2,783,525 2,207,794
Cable:
Cable 1,253,053 1,186,398
Internet 378,912 322,290
Video store operations 316,954 282,635
Intercompany eliminations (3,264) (3,201)
1,945,655 1,788,122
Media:
Advertising 470,768 456,357
Circulation and subscription 126,852 127,258
Retail 230,865 210,547
Other 71,278 60,830
899,763 854,992
Blue Jays 61,849 –
Corporate items and intercompany eliminations (82,543) (59,052)
$ 5,608,249 $ 4,791,856