Rogers 2004 Annual Report Download - page 24
Download and view the complete annual report
Please find page 24 of the 2004 Rogers annual report below. You can navigate through the pages in the report by either clicking on the pages listed below, or by using the keyword search tool below to find specific information within the annual report.-
 1
1 -
2
-
3
-
4
-
5
-
6
-
7
-
8
-
9
-
10
-
11
-
12
-
13
-
 14
14 -
 15
15 -
 16
16 -
 17
17 -
 18
18 -
 19
19 -
 20
20 -
 21
21 -
 22
22 -
 23
23 -
 24
24 -
 25
25 -
 26
26 -
 27
27 -
 28
28 -
 29
29 -
 30
30 -
 31
31 -
 32
32 -
 33
33 -
 34
34 -
35
-
36
-
37
-
38
-
39
-
40
-
41
-
42
-
43
-
44
-
45
-
46
-
47
-
48
-
49
-
50
-
51
-
52
-
53
-
54
-
55
-
56
-
57
-
58
-
59
-
60
-
61
-
62
-
63
-
64
-
65
-
66
-
67
-
68
-
69
-
70
-
71
-
72
-
73
-
74
-
75
-
76
-
77
-
78
-
79
-
80
-
81
-
82
-
83
-
84
-
85
-
86
-
87
-
88
-
89
-
90
-
91
-
92
-
93
-
94
-
95
-
96
-
97
-
98
-
99
-
100
-
101
-
102
-
103
-
104
-
105
-
106
-
107
-
108
-
109
-
110
-
111
-
112
-
113
-
114
-
115
-
116
 |
 |

22 Rogers Communications Inc. 2004 Annual Report
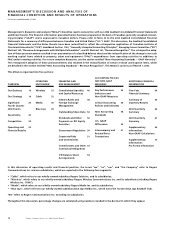
Our consolidated revenue was $5,608.3 million in 2004, an increase of $816.4 million, or 17.0%, from $4,791.9 million in 2003. Of the
increase, Wireless contributed $575.7 million, Cable $157.6 million, Media $44.8 million and Blue Jays $61.9 million. Effective July 31, 2004,
as more fully described below, we began to consolidate the Blue Jays. As a result, equity losses of the Blue Jays for 2003 and for the first
seven months of 2004 are included in losses from investments accounted for by the equity method, and the financial results of the Blue
Jays for the last five months of 2004 are consolidated with our operations.
Our consolidated operating profit was $1,734.2 million, an increase of $285.3 million, or 19.7%, from $1,448.9 million in 2003.
Wireless contributed $222.8 million, Cable $45.2 million, Media $14.8 million and Blue Jays ($6.1 million) of the operating profit increase
(decrease). Consolidated operating profit as a percentage of operating revenue (“operating profit margin”) increased to 30.9% in 2004
from 30.2% in 2003. Refer to the respective individual segment discussions for details of the revenue, operating expenses, operating
profit and additions to PP&E of Wireless, Cable, Media and Blue Jays.
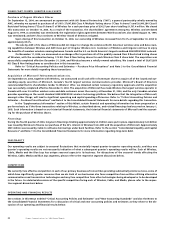
On a consolidated basis, we recorded a net loss of $13.2 million for the year ended December 31, 2004, as compared to net
income of $129.2 million in 2003.
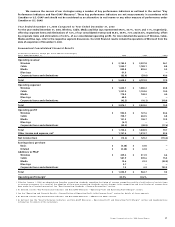
RECONCILIATION OF OPERATING PROFIT TO NET INCOME (LOSS)
The items listed below represent the consolidated income and expense amounts that are required to reconcile operating profit to net
income as defined under Canadian GAAP.
(In millions of dollars)
Years Ended December 31, 2004 2003
Operating profit1$ 1,734.2 $ 1,448.9
Depreciation and amortization (1,092.6) (1,040.3)
Operating income 641.6 408.6
Interest on long-term debt and other (522.1) (488.9)
Gain on sale of investments 14.5 17.9
Writedown of investments (6.0) –
Income (loss) from investments accounted for by the equity method (18.7) (54.0)
Foreign exchange gain (loss) (67.6) 303.7
Change in the fair value of derivative instruments 26.8 –
Loss on repayment of long-term debt (28.2) (24.8)
Investment and other income 29.5 2.2
Income tax recovery (expense) (3.4) 22.9
Non-controlling interest (79.6) (58.4)
Net income (loss) for the year $ (13.2) $ 129.2
1 As defined. See the “Key Performance Indicators and Non-GAAP measures – Operating Profit and Operating Profit Margin” section.
Depreciation and Amortization Expense
Depreciation and amortization expense was $52.3 million higher in 2004 compared to 2003, primarily due to increased amortization of
intangible assets of $49.7 million arising from the acquisition of Microcell and the non-controlling interests in Wireless, which going
forward is expected to increase annual amortization expense by approximately $316 million. Subsequent adjustments to the purchase
price allocations may impact depreciation and amortization going forward.
Operating Income
Operating income was $641.6 million in 2004, an increase of $233.0 million, or 57.0%, from $408.6 million in 2003, reflecting the combina-
tion of increased operating profit partially offset by increased depreciation and amortization expense.
Interest Expense on Long-Term Debt
Interest expense in 2004 increased by $33.2 million compared to 2003, due primarily to the increase in long-term debt in the fourth quarter
of 2004 associated with the acquisitions of Microcell and AWE’s interest in Wireless.
Gain on Sale of Investments
Gain on sale of investments in 2004 was $14.5 million, primarily consisting of the gain realized on the exchange of Cogeco Cable Inc.
shares for shares of Cogeco Inc.
Income (Loss) From Investments Accounted for by the Equity Method
We use the equity method to record losses and income from investments that we do not control, but over which we are able to exercise
significant influence. The equity loss of $18.7 million for the year ended December 31, 2004 was reduced compared to the $54.0 million
loss in 2003. The equity loss in 2003 consisted primarily of the Blue Jays’ losses of $56.5 million, which were accounted for by the equity
method. Effective July 31, 2004, due to the redemption of the Class A Preferred Voting shares as more fully described in the “Blue Jays”
section, we began to consolidate the Blue Jays. As a result, the losses of the Blue Jays for the first seven months of 2004 of $22.7 million
are included in losses from investments accounted for by the equity method during that period, while the Blue Jays’ results for the five
months ended December 31, 2004, are consolidated with our operations.