Rogers 2004 Annual Report Download - page 102
Download and view the complete annual report
Please find page 102 of the 2004 Rogers annual report below. You can navigate through the pages in the report by either clicking on the pages listed below, or by using the keyword search tool below to find specific information within the annual report.-
 1
1 -
2
-
3
-
4
-
5
-
6
-
7
-
8
-
9
-
10
-
11
-
12
-
13
-
14
-
15
-
16
-
17
-
18
-
19
-
20
-
21
-
22
-
23
-
24
-
25
-
26
-
27
-
28
-
29
-
30
-
31
-
32
-
33
-
34
-
35
-
36
-
37
-
38
-
39
-
40
-
41
-
42
-
43
-
44
-
45
-
46
-
47
-
48
-
49
-
50
-
51
-
52
-
53
-
54
-
55
-
56
-
57
-
58
-
59
-
60
-
61
-
62
-
63
-
64
-
65
-
66
-
67
-
68
-
69
-
70
-
71
-
72
-
73
-
74
-
75
-
76
-
77
-
78
-
79
-
80
-
81
-
82
-
83
-
84
-
85
-
86
-
87
-
88
-
89
-
90
-
91
-
 92
92 -
 93
93 -
 94
94 -
 95
95 -
 96
96 -
 97
97 -
 98
98 -
 99
99 -
 100
100 -
 101
101 -
 102
102 -
 103
103 -
 104
104 -
 105
105 -
 106
106 -
 107
107 -
 108
108 -
 109
109 -
 110
110 -
 111
111 -
 112
112 -
113
-
114
-
115
-
116
 |
 |

100 Rogers Communications Inc. 2004 Annual Report
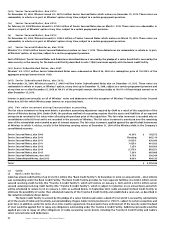
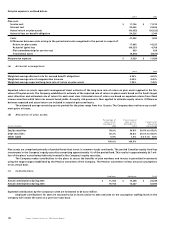
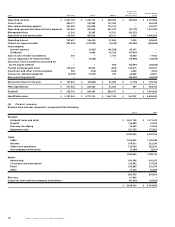
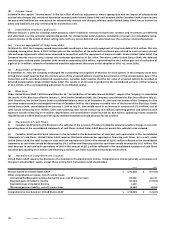
Net plan expense is outlined below:
2004 2003
Plan cost:
Service cost $ 11,746 $ 11,314
Interest cost 24,003 23,826
Actual return on plan assets (43,053) (36,332)
Actuarial loss on benefit obligation 54,526 2,744
Costs 47,222 1,552
Differences between costs arising in the period and costs recognized in the period in respect of:
Return on plan assets 17,900 14,225
Actuarial (gain) loss (49,537) 4,708
Plan amendments/prior service cost 829 829
Transitional asset (9,875) (9,875)
Net pension expense $ 6,539 $ 11,439
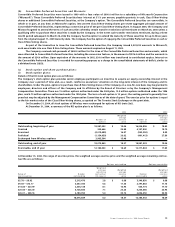
(a) Actuarial assumptions:
2004 2003
Weighted average discount rate for accrued benefit obligations 6.25% 6.25%
Weighted average rate of compensation increase 4.00% 4.00%
Weighted average expected long-term rate of return on plan assets 7.25% 7.25%
Expected return on assets represents management’s best estimate of the long-term rate of return on plan assets applied to the fair
value of the plan assets. The Company establishes its estimate of the expected rate of return on plans assets based on the fund’s target
asset allocation and estimated rate of return for each asset class. Estimated rates of return are based on expected returns from fixed
income securities which take into account bond yields. An equity risk premium is then applied to estimate equity returns. Differences
between expected and actual return are included in actuarial gains and losses.
The estimated average remaining service periods for the plans range from 9 to 13 years. The Company does not have any curtail-
ment gains or losses.
(b) Allocation of plan assets:
Percentage of Percentage of
plan assets, plan assets, Target asset
December 31, December 31, allocation
Asset category 2004 2003 percentage
Equity securities 58.9% 59.8% 50.0% to 65.0%
Debt securities 40.2% 38.8% 35.0% to 50.0%
Other (cash) 0.9% 1.4% 0.0 % to 1.0%
100.0% 100.0%
Plan assets are comprised primarily of pooled funds that invest in common stocks and bonds. The pooled Canadian equity fund has
investments in the Company’s equity securities comprising approximately 1% of the pooled fund. This results in approximately $0.7 mil-
lion of the plans’ assets being indirectly invested in the Company’s equity securities.
The Company makes contributions to the plans to secure the benefits of plan members and invests in permitted investments
using the target ranges established by the Pension Committee of the Company. The Pension Committee reviews actuarial assumptions
on an annual basis.
(c) Contributions:
Employer Employee Total
Actual contributions during 2003 $ 11,000 $ 13,248 $ 24,248
Actual contributions during 2004 19,153 13,237 32,390
Expected contributions by the Company in 2005 are estimated to be $23.0 million.
Employee contributions for 2005 are assumed to be at levels similar to 2003 and 2004 on the assumption staffing levels in the
Company will remain the same on a year-over-year basis.