Rogers 2004 Annual Report Download - page 39
Download and view the complete annual report
Please find page 39 of the 2004 Rogers annual report below. You can navigate through the pages in the report by either clicking on the pages listed below, or by using the keyword search tool below to find specific information within the annual report.-
 1
1 -
2
-
3
-
4
-
5
-
6
-
7
-
8
-
9
-
10
-
11
-
12
-
13
-
14
-
15
-
16
-
17
-
18
-
19
-
20
-
21
-
22
-
23
-
24
-
25
-
26
-
27
-
28
-
 29
29 -
 30
30 -
 31
31 -
 32
32 -
 33
33 -
 34
34 -
 35
35 -
 36
36 -
 37
37 -
 38
38 -
 39
39 -
 40
40 -
 41
41 -
 42
42 -
 43
43 -
 44
44 -
 45
45 -
 46
46 -
 47
47 -
 48
48 -
 49
49 -
50
-
51
-
52
-
53
-
54
-
55
-
56
-
57
-
58
-
59
-
60
-
61
-
62
-
63
-
64
-
65
-
66
-
67
-
68
-
69
-
70
-
71
-
72
-
73
-
74
-
75
-
76
-
77
-
78
-
79
-
80
-
81
-
82
-
83
-
84
-
85
-
86
-
87
-
88
-
89
-
90
-
91
-
92
-
93
-
94
-
95
-
96
-
97
-
98
-
99
-
100
-
101
-
102
-
103
-
104
-
105
-
106
-
107
-
108
-
109
-
110
-
111
-
112
-
113
-
114
-
115
-
116
 |
 |

37
Rogers Communications Inc. 2004 Annual Report
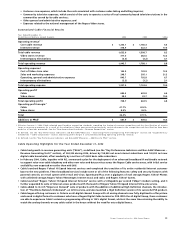
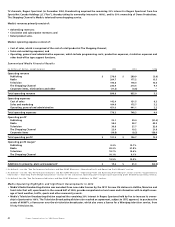
Cable and Video Stores Operating Expenses
Year Ended December 31,
(In millions of dollars) 2004 2003 % Chg
Cable operating expenses:1
Sales and marketing expenses $ 123.3 $ 89.3 38.1
Operating, general and administrative expenses 828.1 779.6 6.2
Total Cable operating expenses 951.4 868.9 9.5
Video stores operating expenses
Cost of sales 145.9 129.9 12.3
Sales and marketing expenses 125.4 115.8 8.3
Operating, general and administrative expenses 17.6 13.2 33.3
Total Video stores operating expenses 288.9 258.9 11.6
Intercompany eliminations (3.3) (3.2) 3.1
Operating expenses $ 1,237.0 $ 1,124.6 10.0
1 As reclassified – See the “New Accounting Standards – Revenue Recognition” section.
Cable sales and marketing expenses increased by $34.0 million, or 38.1%, in 2004, compared to 2003. The increase reflects the launch of
and transition to the new Rogers Yahoo! Hi-Speed Internet offering across the entire residential Internet subscriber base, which was
supported with a significant marketing campaign. In addition, Cable significantly increased the level of spending on market awareness
of its unique digital cable offerings and on-demand capabilities versus satellite, as well as an increased sales and distribution presence
in retail locations.
The $48.5 million, or 6.2%, increase in cable operating, general and administrative expenses in 2004, compared to 2003, primarily
relates to increased costs of programming associated with the growth in digital cable subscribers and the cost related to the deploy-
ment of digital set-top terminals; increased costs directly related to servicing a growing base of Internet subscribers; increased pension
expense; and the impact of expensing stock options, which began in 2004.
The $16.0 million increase in cost of sales at the Rogers Video stores reflects the higher sales volumes as well as the increased
number of store locations. The growth in store locations, from 279 stores at December 31, 2003, to 294 stores at December 31, 2004, was
the primary driver of the increase in Rogers Video store sales and marketing expenses, which includes the cost of operating the stores.
The $4.4 million increase in operating, general and administrative expenses for Rogers Video stores reflects increases in costs related to
functions such as human resources and administration.
Cable Operating Profit
The 6.4% growth in total cable operating profit reflects the 8.2% revenue growth being more than offset by the 9.5% increase in total
cable operating expenses. The 19.0% increase in operating profit at the Rogers Video stores was due to increased same store revenues,
operating efficiencies and improved margins on the rental and sale of products.
The revenue and expense changes described above resulted in the core cable operating margin for 2004 declining to 41.7%, com-
pared to 42.4% in 2003. This compression of Cable’s core cable operating margin resulted from its increase in sales and marketing
expense as it supported the launch of a large array of new Internet and digital services as described above, the expensing of stock
options and increased pension expense. Rogers Video operating margins increased to 8.9% in 2004, from 8.4% in the corresponding
period of the prior year, as described above.
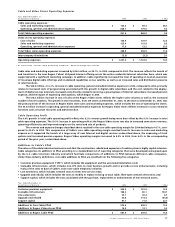
Additions to Cable’s PP&E
The nature of the cable television business is such that the construction, rebuild and expansion of a cable system is highly capital-intensive.
Cable categorizes its additions to PP&E according to a standardized set of reporting categories that were developed and agreed upon
by the U.S. cable television industry and which facilitate comparisons of additions to PP&E between different cable companies.
Under these industry definitions, core cable additions to PP&E are classified into the following five categories:
• Customer premises equipment (“CPE”), which includes the equipment and the associated installation costs;
• Scaleable infrastructure, which includes non-CPE costs to meet business growth and to provide service enhancements, including
many of the costs to date of Cable’s voice-over-cable telephony initiative;
• Line extensions, which includes network costs to enter new service areas;
• Upgrade and rebuild, which includes the costs to modify or replace existing co-axial cable, fibre-optic network electronics; and
• Support capital, which includes the costs associated with the purchase, replacement or enhancement of non-network assets.
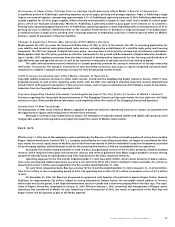
Year Ended December 31,
(In millions of dollars) 2004 2003 %Chg
Customer premises equipment $ 204.0 $ 181.6 12.3
Scaleable infrastructure 188.0 80.1 134.7
Line extensions 53.7 49.4 8.7
Upgrade and rebuild 40.8 114.4 (64.3)
Support capital 87.1 71.0 22.7
Additions to Core Cable PP&E 573.6 496.5 15.5
Additions to Rogers Video stores PP&E 14.3 13.1 9.2
Additions to Rogers Cable PP&E $ 587.9 $ 509.6 15.4