Rogers 2004 Annual Report Download - page 69
Download and view the complete annual report
Please find page 69 of the 2004 Rogers annual report below. You can navigate through the pages in the report by either clicking on the pages listed below, or by using the keyword search tool below to find specific information within the annual report.-
 1
1 -
2
-
3
-
4
-
5
-
6
-
7
-
8
-
9
-
10
-
11
-
12
-
13
-
14
-
15
-
16
-
17
-
18
-
19
-
20
-
21
-
22
-
23
-
24
-
25
-
26
-
27
-
28
-
29
-
30
-
31
-
32
-
33
-
34
-
35
-
36
-
37
-
38
-
39
-
40
-
41
-
42
-
43
-
44
-
45
-
46
-
47
-
48
-
49
-
50
-
51
-
52
-
53
-
54
-
55
-
56
-
57
-
58
-
 59
59 -
 60
60 -
 61
61 -
 62
62 -
 63
63 -
 64
64 -
 65
65 -
 66
66 -
 67
67 -
 68
68 -
 69
69 -
 70
70 -
 71
71 -
 72
72 -
 73
73 -
 74
74 -
 75
75 -
 76
76 -
 77
77 -
 78
78 -
 79
79 -
80
-
81
-
82
-
83
-
84
-
85
-
86
-
87
-
88
-
89
-
90
-
91
-
92
-
93
-
94
-
95
-
96
-
97
-
98
-
99
-
100
-
101
-
102
-
103
-
104
-
105
-
106
-
107
-
108
-
109
-
110
-
111
-
112
-
113
-
114
-
115
-
116
 |
 |

67
Rogers Communications Inc. 2004 Annual Report
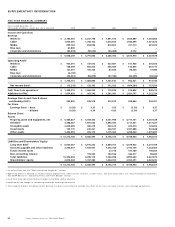
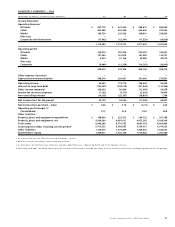
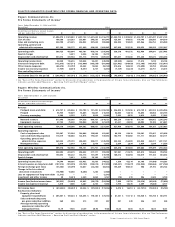
QUARTERLY SUMMARY – 2003
(thousands of dollars, except per share amounts) Q1 Q2 Q3 Q4
Income Statement
Operating Revenue1
Wireless2$ 497,118 $ 532,462 $ 588,615 $ 589,599
Cable 432,998 434,386 445,646 475,092
Media 196,726 219,706 194,691 243,869
Blue Jays ––––
Corporate and eliminations (11,462) (13,341) (17,329) (16,920)
1,115,380 1,173,213 1,211,623 1,291,640
Operating profit3
Wireless 155,810 182,546 222,295 166,921
Cable 157,290 161,878 167,585 176,721
Media 6,020 37,106 20,988 42,610
Blue Jays ––––
Corporate (9,846) (11,324) (10,762) (16,942)
309,274 370,206 400,106 369,310
Other expense (recovery) ––––
Depreciation and amortization 248,319 256,427 261,666 273,851
Operating income 60,955 113,779 138,440 95,459
Interest on long-term debt (123,547) (128,010) (121,944) (115,364)
Other income (expense) 109,620 96,860 (12,045) 50,558
Income tax recovery (expense) (7,132) (3,372) (3,039) 36,400
Non-controlling interest (16,158) (25,197) (18,854) 1,784
Net income (loss) for the period 23,738 54,060 (17,442) 68,837
Net income (loss) per share – basic $ 0.06 $ 0.18 $ (0.13) $ 0.24
Operating profit margin %3
Consolidated 27.7 31.6 33.0 28.6
Other Statistics
Property, plant and equipment expenditures $ 188,950 $ 222,312 $ 244,722 $ 307,758
Property, plant and equipment, net 5,004,390 4,981,017 4,975,265 5,039,304
Total assets 8,446,249 8,791,553 8,481,103 8,465,495
Total long-term debt, including current portion45,713,322 5,565,682 5,134,251 4,970,232
Other liabilities 1,124,619 1,315,839 1,439,643 1,534,541
Shareholders’ equity 1,459,611 1,736,140 1,714,462 1,767,380
1 As reclassified, see the “New Accounting Standards” section.
2 Wireless revenue restated to reflect roaming revenue.
3 As defined in “Key Performance Indicators and Non-GAAP Measures – Operating Profit and Profit Margin” section.
4 Total long-term debt, including current portion, has been reclassified to exclude the effect of cross-currency interest rate exchange agreements for all periods.