Kodak 2007 Annual Report Download - page 97
Download and view the complete annual report
Please find page 97 of the 2007 Kodak annual report below. You can navigate through the pages in the report by either clicking on the pages listed below, or by using the keyword search tool below to find specific information within the annual report.-
 1
1 -
2
-
3
-
4
-
5
-
6
-
7
-
8
-
9
-
10
-
11
-
12
-
13
-
14
-
15
-
16
-
17
-
18
-
19
-
20
-
21
-
22
-
23
-
24
-
25
-
26
-
27
-
28
-
29
-
30
-
31
-
32
-
33
-
34
-
35
-
36
-
37
-
38
-
39
-
40
-
41
-
42
-
43
-
44
-
45
-
46
-
47
-
48
-
49
-
50
-
51
-
52
-
53
-
54
-
55
-
56
-
57
-
58
-
59
-
60
-
61
-
62
-
63
-
64
-
65
-
66
-
67
-
68
-
69
-
70
-
71
-
72
-
73
-
74
-
75
-
76
-
77
-
78
-
79
-
80
-
81
-
82
-
83
-
84
-
85
-
86
-
 87
87 -
 88
88 -
 89
89 -
 90
90 -
 91
91 -
 92
92 -
 93
93 -
 94
94 -
 95
95 -
 96
96 -
 97
97 -
 98
98 -
 99
99 -
 100
100 -
 101
101 -
 102
102 -
 103
103 -
 104
104 -
 105
105 -
 106
106 -
 107
107 -
108
-
109
-
110
-
111
-
112
-
113
-
114
-
115
-
116
-
117
-
118
-
119
-
120
-
121
-
122
-
123
-
124
-
125
-
126
-
127
-
128
-
129
-
130
-
131
-
132
-
133
-
134
-
135
-
136
-
137
-
138
-
139
-
140
-
141
-
142
-
143
-
144
-
145
-
146
-
147
-
148
-
149
-
150
-
151
-
152
-
153
-
154
-
155
-
156
-
157
-
158
-
159
-
160
-
161
-
162
-
163
-
164
-
165
-
166
-
167
-
168
-
169
-
170
-
171
-
172
-
173
-
174
-
175
-
176
-
177
-
178
-
179
-
180
-
181
-
182
-
183
-
184
-
185
-
186
-
187
-
188
-
189
-
190
-
191
-
192
-
193
-
194
-
195
-
196
-
197
-
198
-
199
-
200
-
201
-
202
-
203
-
204
-
205
-
206
-
207
-
208
-
209
-
210
-
211
-
212
-
213
-
214
-
215
 |
 |

96
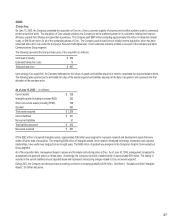
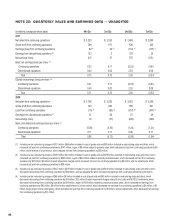
NOTE 25: QUARTERLY SALES AND EARNINGS DATA — UNAUDITED
(in millions, except per share data)
4th Qtr.
3rd Qtr.
2nd Qtr.
1st Qtr.
2007
Net sales from continuing operations $ 3,220 $ 2,533 $ 2,468 $ 2,080
Gross profit from continuing operations 789 671 636 420
Earnings (loss) from continuing operations 92 (4) 32 (3) (154) (2) (175) (1)
Earnings from discontinued operations (9) 123 5 729 24
Net earnings (loss) 215 37 575 (151)
Basic net earnings (loss) per share (10)
Continuing operations 0.32 0.11 (0.53) (0.61)
Discontinued operations 0.43 0.02 2.53 0.08
Total 0.75 0.13 2.00 (0.53)
Diluted net earnings (loss) per share (10)
Continuing operations 0.31 0.11 (0.53) (0.61)
Discontinued operations 0.40 0.02 2.53 0.08
Total 0.71 0.13 2.00 (0.53)
2006
Net sales from continuing operations $ 3,106 $ 2,555 $ 2,652 $ 2,255
Gross profit from continuing operations 740 640 568 461
Loss from continuing operations (15) (8) (85) (7) (357) (6) (347) (5)
Earnings from discontinued operations (9) 31 48 75 49
Net earnings (loss) 16 (37) (282) (298)
Basic and diluted net earnings (loss) per share (10)
Continuing operations (0.05) (0.30) (1.24) (1.21)
Discontinued operations 0.11 0.17 0.26 0.17
Total 0.06 (0.13) (0.98) (1.04)
(1) Includes pre-tax restructuring charges of $151 million ($66 million included in cost of goods sold and $85 million included in restructuring costs and other), which
increased net loss from continuing operations by $141 million; a gain of $9 million related to property sales, which reduced net loss from continuing operations by $9
million; and a reversal of a tax reserve, which reduced net loss from continuing operations by $56 million.
(2) Includes pre-tax restructuring charges of $316 million ($21 million included in cost of goods sold and $295 million included in restructuring costs and other), which
increased net loss from continuing operations by $248 million; a gain of $40 million related to property and asset sales, which decreased net loss from continuing
operations by $27 million; $6 million of asset impairment charges, which increased net loss from continuing operations by $4 million; and tax adjustments, which
increased net loss from continuing operations by $39 million.
(3) Includes pre-tax restructuring charges of $127 million ($27 million included in cost of goods sold and $100 million included in restructuring costs and other), which
decreased net earnings from continuing operations by $96 million; and tax adjustments, which increased net earnings from continuing operations by $8 million.
(4) Includes pre-tax restructuring charges of $68 million ($5 million included in cost of good sold and $63 million included in restructuring costs and other), which
decreased net earnings from continuing operations by $44 million; $51 million of asset impairment charges related to the Lucky and MUTEC investments, which
decreased net earnings from continuing operations by $49 million; a gain of $108 million related to property and asset sales, which increased net earnings from
continuing operations by $83 million; $6 million for the establishment of a loan reserve, which decreased net earnings from continuing operations by $4 million; a $9
million foreign export charge contingency, which decreased net earnings from continuing operations by $9 million; and tax adjustments, which decreased net earnings
from continuing operations by $11 million.