Kodak 2007 Annual Report Download - page 33
Download and view the complete annual report
Please find page 33 of the 2007 Kodak annual report below. You can navigate through the pages in the report by either clicking on the pages listed below, or by using the keyword search tool below to find specific information within the annual report.-
 1
1 -
2
-
3
-
4
-
5
-
6
-
7
-
8
-
9
-
10
-
11
-
12
-
13
-
14
-
15
-
16
-
17
-
18
-
19
-
20
-
21
-
22
-
 23
23 -
 24
24 -
 25
25 -
 26
26 -
 27
27 -
 28
28 -
 29
29 -
 30
30 -
 31
31 -
 32
32 -
 33
33 -
 34
34 -
 35
35 -
 36
36 -
 37
37 -
 38
38 -
 39
39 -
 40
40 -
 41
41 -
 42
42 -
 43
43 -
44
-
45
-
46
-
47
-
48
-
49
-
50
-
51
-
52
-
53
-
54
-
55
-
56
-
57
-
58
-
59
-
60
-
61
-
62
-
63
-
64
-
65
-
66
-
67
-
68
-
69
-
70
-
71
-
72
-
73
-
74
-
75
-
76
-
77
-
78
-
79
-
80
-
81
-
82
-
83
-
84
-
85
-
86
-
87
-
88
-
89
-
90
-
91
-
92
-
93
-
94
-
95
-
96
-
97
-
98
-
99
-
100
-
101
-
102
-
103
-
104
-
105
-
106
-
107
-
108
-
109
-
110
-
111
-
112
-
113
-
114
-
115
-
116
-
117
-
118
-
119
-
120
-
121
-
122
-
123
-
124
-
125
-
126
-
127
-
128
-
129
-
130
-
131
-
132
-
133
-
134
-
135
-
136
-
137
-
138
-
139
-
140
-
141
-
142
-
143
-
144
-
145
-
146
-
147
-
148
-
149
-
150
-
151
-
152
-
153
-
154
-
155
-
156
-
157
-
158
-
159
-
160
-
161
-
162
-
163
-
164
-
165
-
166
-
167
-
168
-
169
-
170
-
171
-
172
-
173
-
174
-
175
-
176
-
177
-
178
-
179
-
180
-
181
-
182
-
183
-
184
-
185
-
186
-
187
-
188
-
189
-
190
-
191
-
192
-
193
-
194
-
195
-
196
-
197
-
198
-
199
-
200
-
201
-
202
-
203
-
204
-
205
-
206
-
207
-
208
-
209
-
210
-
211
-
212
-
213
-
214
-
215
 |
 |

32
Selling, General and Administrative Expenses
The year-over-year decline in SG&A was attributable to Company-wide cost reduction initiatives.
Research and Development Costs
The decrease in R&D costs was primarily attributable to significant reductions in spending related to traditional products and services.
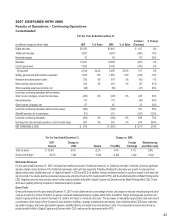
Graphic Communications Group
For the Year Ended December 31,
(dollars in millions)
2006
% of
Sales
2005
% of
Sales
Increase /
(Decrease)
% Change
Digital net sales $ 2,950 $ 2,271 $ 679 30%
Traditional net sales 527 554 (27) -5%
Total net sales 3,477 2,825 652 23%
Cost of goods sold 2,480 2,066 414 20%
Gross profit 997 28.7% 759 26.9% 238 31%
Selling, general and administrative expenses 697 20% 549 19% 148 27%
Research and development costs 200 6% 281 10% (81) -29%
Earnings (loss) from continuing operations before interest,
other income (charges), net and income taxes
$ 100
3%
$ (71)
-3%
$ 171
241%
For the Year Ended December 31, Change vs. 2005
2006
Amount
Change vs.
2005
Volume
Price/Mix
Foreign
Exchange
Manufacturing
and Other Costs
Acquisition
Total net sales $ 3,477 23.1% 4.9% -5.3% 0.9% 0.0% 22.6%
Gross profit margin 28.7% 1.8pp 0.0pp 1.2pp -0.4pp 0.5pp 0.5pp
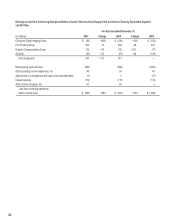
Worldwide Revenues
Digital net sales are comprised of Enterprise Solutions, Digital Printing Solutions, portions of Prepress Solutions and portions of Document Imaging. The
30% growth in digital product sales led to total revenue growth of 23%, which was primarily attributable to acquisitions of KPG and Creo in the second
quarter of 2005.
The increase in sales was also driven by volume increases in Prepress Solutions, offset by unfavorable price/mix in Prepress Solutions and Document
Imaging.
Net worldwide sales of Prepress Solutions, including consumables, prepress equipment and related services, increased 33% primarily driven by the
acquisitions of KPG and Creo and strong volume increases within the digital portion of Prepress Solutions.
Net worldwide sales of Document Imaging, which includes document scanners and services, media, and imaging services, were flat compared with 2005.
Favorable volume and foreign currency were offset by unfavorable price/mix.
Net worldwide sales of Digital Printing Solutions, including all continuous inkjet and electrophotographic equipment, consumables and service, was flat
compared with 2005.
Net worldwide sales of Enterprise Solutions, which includes workflow software and digital controller development, grew 55% driven by the acquisitions of
KPG and Creo.
Gross Profit
The increase in gross profit margin as compared with 2005 was primarily driven by the acquisitions of KPG and Creo, favorable price/mix within Prepress
Solutions, and decreased manufacturing and other costs. These increases were partially offset by unfavorable foreign currency.
Selling, General and Administrative Expenses
The increase in SG&A is primarily attributable to $148 million of SG&A costs associated with the acquired KPG and Creo businesses, and redistribution of
corporate costs associated with bringing acquired businesses into the Kodak portfolio, partially offset by integration synergies.