Kodak 2007 Annual Report Download - page 31
Download and view the complete annual report
Please find page 31 of the 2007 Kodak annual report below. You can navigate through the pages in the report by either clicking on the pages listed below, or by using the keyword search tool below to find specific information within the annual report.-
 1
1 -
2
-
3
-
4
-
5
-
6
-
7
-
8
-
9
-
10
-
11
-
12
-
13
-
14
-
15
-
16
-
17
-
18
-
19
-
20
-
 21
21 -
 22
22 -
 23
23 -
 24
24 -
 25
25 -
 26
26 -
 27
27 -
 28
28 -
 29
29 -
 30
30 -
 31
31 -
 32
32 -
 33
33 -
 34
34 -
 35
35 -
 36
36 -
 37
37 -
 38
38 -
 39
39 -
 40
40 -
 41
41 -
42
-
43
-
44
-
45
-
46
-
47
-
48
-
49
-
50
-
51
-
52
-
53
-
54
-
55
-
56
-
57
-
58
-
59
-
60
-
61
-
62
-
63
-
64
-
65
-
66
-
67
-
68
-
69
-
70
-
71
-
72
-
73
-
74
-
75
-
76
-
77
-
78
-
79
-
80
-
81
-
82
-
83
-
84
-
85
-
86
-
87
-
88
-
89
-
90
-
91
-
92
-
93
-
94
-
95
-
96
-
97
-
98
-
99
-
100
-
101
-
102
-
103
-
104
-
105
-
106
-
107
-
108
-
109
-
110
-
111
-
112
-
113
-
114
-
115
-
116
-
117
-
118
-
119
-
120
-
121
-
122
-
123
-
124
-
125
-
126
-
127
-
128
-
129
-
130
-
131
-
132
-
133
-
134
-
135
-
136
-
137
-
138
-
139
-
140
-
141
-
142
-
143
-
144
-
145
-
146
-
147
-
148
-
149
-
150
-
151
-
152
-
153
-
154
-
155
-
156
-
157
-
158
-
159
-
160
-
161
-
162
-
163
-
164
-
165
-
166
-
167
-
168
-
169
-
170
-
171
-
172
-
173
-
174
-
175
-
176
-
177
-
178
-
179
-
180
-
181
-
182
-
183
-
184
-
185
-
186
-
187
-
188
-
189
-
190
-
191
-
192
-
193
-
194
-
195
-
196
-
197
-
198
-
199
-
200
-
201
-
202
-
203
-
204
-
205
-
206
-
207
-
208
-
209
-
210
-
211
-
212
-
213
-
214
-
215
 |
 |

30
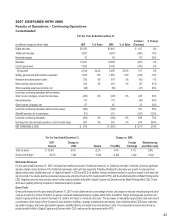
Income Tax Provision
(dollars in millions)
For the Year Ended December 31,
2006 2005
Loss from continuing operations before income taxes ($ 583) ($ 1,208)
Provision for income taxes $ 221 $ 449
Effective tax rate (37.9)% (37.2)%
The change in the Company’s annual effective tax rate from continuing operations is primarily attributable to the inability to recognize a benefit from losses
in the U.S. and in certain jurisdictions outside the U.S., as a result of the requirement to record a valuation allowance against net deferred tax assets in
those jurisdictions that the Company has determined it is no longer more likely than not that these net deferred tax assets will be realized, and the mix of
earnings from operations in certain lower-taxed jurisdictions outside the U.S.
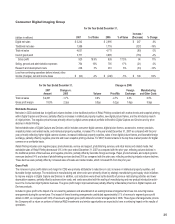
Consumer Digital Imaging Group
For the Year Ended December 31,
(dollars in millions)
2006
% of
Sales
2005
% of
Sales
Increase /
(Decrease)
%
Change
Digital net sales $ 2,995 $ 3,290 $ (295) -9%
Traditional net sales 1,716 2,356 (640) -27%
Total net sales 4,711 5,646 (935) -17%
Cost of goods sold 3,885 4,685 (800) -17%
Gross profit 826 17.5% 961 17.0% (135) -14%
Selling, general and administrative expenses 785 17% 1,035 18% (250) -24%
Research and development costs 281 6% 300 5% (19) -6%
Loss from continuing operations before interest, other
income (charges), net and income taxes
$ (240)
-5%
$ (374)
-7%
$ 134
36%
For the Year Ended December 31, Change vs. 2005
2006
Amount
Change vs.
2005
Volume
Price/Mix
Foreign
Exchange
Manufacturing
and Other Costs
Total net sales $ 4,711 -16.6% -14.3% -2.7% 0.4% 0.0%
Gross profit margin 17.5% 0.5pp 0.0pp 3.0pp 0.2pp -2.7pp
Worldwide Revenues
CDG net sales decreased due to significant volume declines in the traditional portion of Retail Printing and Digital Capture and Devices partially offset by
volume increases in the digital portion of Retail Printing. The negative price/mix was primarily driven by Digital Capture and Devices and by price declines
in Retail Printing.
Net worldwide sales of Digital Capture and Devices, which includes consumer digital cameras, accessories, memory products, snapshot printers and re-
lated media, and intellectual property royalties, decreased 13% in 2006 as compared with 2005, primarily reflecting volume decreases, as well as negative
price/mix. These decreases were partially offset by increased intellectual property royalties as well as favorable foreign currency. According to the NPD
Group’s consumer tracking service, Kodak EasyShare digital cameras were number one in unit market share in the U.S. for the year 2006.
Retail Printing includes color negative paper, photochemicals, service and support, photofinishing services, and retail kiosks and related media. Net
worldwide sales of Retail Printing decreased 21% in the year ended December 31, 2006 as compared with 2005 due to volume and price/mix declines
in the traditional portion of the business and price/mix declines in kiosks and related media. These declines were partially offset by volume increases in
kiosks and related media and favorable foreign exchange. Paper, photochemicals, and output systems revenues declined 20% and sales of photofinishing
services declined 43% as compared with 2005, reflecting continuing industry volume declines.