Kodak 2007 Annual Report Download - page 24
Download and view the complete annual report
Please find page 24 of the 2007 Kodak annual report below. You can navigate through the pages in the report by either clicking on the pages listed below, or by using the keyword search tool below to find specific information within the annual report.-
 1
1 -
2
-
3
-
4
-
5
-
6
-
7
-
8
-
9
-
10
-
11
-
12
-
13
-
 14
14 -
 15
15 -
 16
16 -
 17
17 -
 18
18 -
 19
19 -
 20
20 -
 21
21 -
 22
22 -
 23
23 -
 24
24 -
 25
25 -
 26
26 -
 27
27 -
 28
28 -
 29
29 -
 30
30 -
 31
31 -
 32
32 -
 33
33 -
 34
34 -
35
-
36
-
37
-
38
-
39
-
40
-
41
-
42
-
43
-
44
-
45
-
46
-
47
-
48
-
49
-
50
-
51
-
52
-
53
-
54
-
55
-
56
-
57
-
58
-
59
-
60
-
61
-
62
-
63
-
64
-
65
-
66
-
67
-
68
-
69
-
70
-
71
-
72
-
73
-
74
-
75
-
76
-
77
-
78
-
79
-
80
-
81
-
82
-
83
-
84
-
85
-
86
-
87
-
88
-
89
-
90
-
91
-
92
-
93
-
94
-
95
-
96
-
97
-
98
-
99
-
100
-
101
-
102
-
103
-
104
-
105
-
106
-
107
-
108
-
109
-
110
-
111
-
112
-
113
-
114
-
115
-
116
-
117
-
118
-
119
-
120
-
121
-
122
-
123
-
124
-
125
-
126
-
127
-
128
-
129
-
130
-
131
-
132
-
133
-
134
-
135
-
136
-
137
-
138
-
139
-
140
-
141
-
142
-
143
-
144
-
145
-
146
-
147
-
148
-
149
-
150
-
151
-
152
-
153
-
154
-
155
-
156
-
157
-
158
-
159
-
160
-
161
-
162
-
163
-
164
-
165
-
166
-
167
-
168
-
169
-
170
-
171
-
172
-
173
-
174
-
175
-
176
-
177
-
178
-
179
-
180
-
181
-
182
-
183
-
184
-
185
-
186
-
187
-
188
-
189
-
190
-
191
-
192
-
193
-
194
-
195
-
196
-
197
-
198
-
199
-
200
-
201
-
202
-
203
-
204
-
205
-
206
-
207
-
208
-
209
-
210
-
211
-
212
-
213
-
214
-
215
 |
 |

23
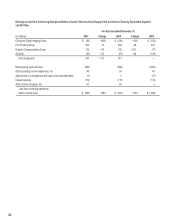
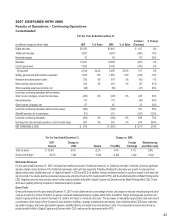
2007 COMPARED WITH 2006
Results of Operations – Continuing Operations
Consolidated
For the Year Ended December 31,
(in millions, except per share data)
2007
% of Sales
2006
% of Sales
Increase /
(Decrease)
% Change
Digital net sales $ 6,392 $ 5,945 $ 447 8%
Traditional net sales 3,877 4,574 (697) -15%
New technologies 32 49 (17) -35%
Net sales 10,301 10,568 (267) -3%
Cost of goods sold 7,785 8,159 (374) -5%
Gross profit 2,516 24.4% 2,409 22.8% 107 4%
Selling, general and administrative expenses 1,764 17% 1,950 18% (186) -10%
Research and development costs 535 5% 578 5% (43) -7%
Restructuring costs and other 543 5% 416 4% 127 31%
Other operating expenses (income), net (96) (59) (37) 63%
Loss from continuing operations before interest,
other income (charges), net and income taxes
(230)
-2%
(476)
-5%
246
52%
Interest expense 113 172 (59) -34%
Other income (charges), net 87 65 22 34%
Loss from continuing operations before income taxes (256) (583) 327 56%
(Benefit) provision for income taxes (51) 221 (272) -123%
Loss from continuing operations (205) -2% (804) -8% 599 75%
Earnings from discontinued operations, net of income taxes 881 9% 203 2% 678 334%
NET EARNINGS (LOSS) $ 676 $ (601) $ 1,277 212%
For the Year Ended December 31, Change vs. 2006
2007
Amount
Change vs.
2006
Volume
Price/Mix
Foreign
Exchange
Manufacturing
and Other Costs
Total net sales $ 10,301 -2.5% -2.2% -3.4% 3.1% 0.0%
Gross profit margin 24.4% 1.6pp 0.0pp -4.2pp 1.4pp 4.4pp
Worldwide Revenues
For the year ended December 31, 2007, net sales from traditional products (“traditional revenues” or “traditional net sales”) declined, driven by significant
industry-related volume declines in the traditional businesses within all three segments. Partially offsetting this decrease was growth in revenues from
digital product sales (“digital revenues” or “digital net sales”) in CDG and GCG. In addition, foreign exchange resulted in a positive impact to net sales dur-
ing the period. The volume declines presented above were primarily driven by Film Capture within FPG, and the traditional portion of Retail Printing within
CDG. Negative price/mix was primarily driven by the product portfolio shifts within Digital Capture and Devices and by Retail Printing within CDG. These
items were partially offset by increases in intellectual property royalties.
Gross Profit
Gross profit improved in the year ended December 31, 2007 in both dollars and as a percentage of sales, due largely to reduced manufacturing and other
costs as a result of a number of factors, as well as increased intellectual property royalties within CDG. In addition, foreign exchange was a positive con-
tributor to gross profit as a result of the weak U.S. dollar’s net impact on revenues and costs. The decreases in manufacturing and other costs were due to
a combination of the impact of the Company’s cost reduction initiatives, strategic manufacturing and supply chain initiatives within CDG, lower restructur-
ing-related charges, and lower depreciation expense, partially offset by increased silver and aluminum costs. The unfavorable price/mix was driven by
product portfolio shifts in Digital Capture and Devices within CDG, and across the businesses within FPG.