Kodak 2007 Annual Report Download - page 94
Download and view the complete annual report
Please find page 94 of the 2007 Kodak annual report below. You can navigate through the pages in the report by either clicking on the pages listed below, or by using the keyword search tool below to find specific information within the annual report.-
 1
1 -
2
-
3
-
4
-
5
-
6
-
7
-
8
-
9
-
10
-
11
-
12
-
13
-
14
-
15
-
16
-
17
-
18
-
19
-
20
-
21
-
22
-
23
-
24
-
25
-
26
-
27
-
28
-
29
-
30
-
31
-
32
-
33
-
34
-
35
-
36
-
37
-
38
-
39
-
40
-
41
-
42
-
43
-
44
-
45
-
46
-
47
-
48
-
49
-
50
-
51
-
52
-
53
-
54
-
55
-
56
-
57
-
58
-
59
-
60
-
61
-
62
-
63
-
64
-
65
-
66
-
67
-
68
-
69
-
70
-
71
-
72
-
73
-
74
-
75
-
76
-
77
-
78
-
79
-
80
-
81
-
82
-
83
-
 84
84 -
 85
85 -
 86
86 -
 87
87 -
 88
88 -
 89
89 -
 90
90 -
 91
91 -
 92
92 -
 93
93 -
 94
94 -
 95
95 -
 96
96 -
 97
97 -
 98
98 -
 99
99 -
 100
100 -
 101
101 -
 102
102 -
 103
103 -
 104
104 -
105
-
106
-
107
-
108
-
109
-
110
-
111
-
112
-
113
-
114
-
115
-
116
-
117
-
118
-
119
-
120
-
121
-
122
-
123
-
124
-
125
-
126
-
127
-
128
-
129
-
130
-
131
-
132
-
133
-
134
-
135
-
136
-
137
-
138
-
139
-
140
-
141
-
142
-
143
-
144
-
145
-
146
-
147
-
148
-
149
-
150
-
151
-
152
-
153
-
154
-
155
-
156
-
157
-
158
-
159
-
160
-
161
-
162
-
163
-
164
-
165
-
166
-
167
-
168
-
169
-
170
-
171
-
172
-
173
-
174
-
175
-
176
-
177
-
178
-
179
-
180
-
181
-
182
-
183
-
184
-
185
-
186
-
187
-
188
-
189
-
190
-
191
-
192
-
193
-
194
-
195
-
196
-
197
-
198
-
199
-
200
-
201
-
202
-
203
-
204
-
205
-
206
-
207
-
208
-
209
-
210
-
211
-
212
-
213
-
214
-
215
 |
 |

93
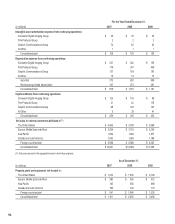
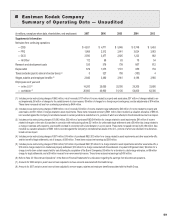
Segment financial information is shown below. Prior period results have been restated to conform to the current period segment reporting structure.
For the Year Ended December 31,
(in millions) 2007 2006 2005
Net sales from continuing operations:
Consumer Digital Imaging Group $ 4,631 $ 4,711 $ 5,646
Film Products Group 1,968 2,312 2,841
Graphic Communications Group 3,590 3,477 2,825
All Other 112 68 83
Consolidated total $ 10,301 $ 10,568 $ 11,395
Earnings (losses) from continuing operations before interest, other income
(charges), net and income taxes:
Consumer Digital Imaging Group $ (92) $ (240) $ (374)
Film Products Group 369 368 573
Graphic Communications Group 116 100 (71)
All Other (50) (67) (128)
Total of segments 343 161 —
Restructuring costs and other (662) (698) (1,092)
Other operating income (expenses), net 96 59 40
Adjustments to contingencies and legal reserves/(settlements) (7) 2 (21)
Interest expense (113) (172) (139)
Other income (charges), net 87 65 4
Consolidated loss from continuing operations before income taxes $ (256) $ (583) $ (1,208)
As of December 31,
(in millions) 2007 2006 2005
Segment total assets:
Consumer Digital Imaging Group $ 3,306 $ 3,170 $ 3,297
Film Products Group 2,739 3,229 3,967
Graphic Communications Group 3,879 3,916 3,879
All Other 36 47 122
Total of segments 9,960 10,362 11,265
Cash and marketable securities 2,976 1,487 1,680
Deferred income tax assets 757 750 550
Other corporate reserves (34) (158) (174)
Assets of discontinued operations — 1,879 1,915
Consolidated total assets $ 13,659 $ 14,320 $ 15,236
continued on next page