Kodak 2007 Annual Report Download - page 29
Download and view the complete annual report
Please find page 29 of the 2007 Kodak annual report below. You can navigate through the pages in the report by either clicking on the pages listed below, or by using the keyword search tool below to find specific information within the annual report.-
 1
1 -
2
-
3
-
4
-
5
-
6
-
7
-
8
-
9
-
10
-
11
-
12
-
13
-
14
-
15
-
16
-
17
-
18
-
 19
19 -
 20
20 -
 21
21 -
 22
22 -
 23
23 -
 24
24 -
 25
25 -
 26
26 -
 27
27 -
 28
28 -
 29
29 -
 30
30 -
 31
31 -
 32
32 -
 33
33 -
 34
34 -
 35
35 -
 36
36 -
 37
37 -
 38
38 -
 39
39 -
40
-
41
-
42
-
43
-
44
-
45
-
46
-
47
-
48
-
49
-
50
-
51
-
52
-
53
-
54
-
55
-
56
-
57
-
58
-
59
-
60
-
61
-
62
-
63
-
64
-
65
-
66
-
67
-
68
-
69
-
70
-
71
-
72
-
73
-
74
-
75
-
76
-
77
-
78
-
79
-
80
-
81
-
82
-
83
-
84
-
85
-
86
-
87
-
88
-
89
-
90
-
91
-
92
-
93
-
94
-
95
-
96
-
97
-
98
-
99
-
100
-
101
-
102
-
103
-
104
-
105
-
106
-
107
-
108
-
109
-
110
-
111
-
112
-
113
-
114
-
115
-
116
-
117
-
118
-
119
-
120
-
121
-
122
-
123
-
124
-
125
-
126
-
127
-
128
-
129
-
130
-
131
-
132
-
133
-
134
-
135
-
136
-
137
-
138
-
139
-
140
-
141
-
142
-
143
-
144
-
145
-
146
-
147
-
148
-
149
-
150
-
151
-
152
-
153
-
154
-
155
-
156
-
157
-
158
-
159
-
160
-
161
-
162
-
163
-
164
-
165
-
166
-
167
-
168
-
169
-
170
-
171
-
172
-
173
-
174
-
175
-
176
-
177
-
178
-
179
-
180
-
181
-
182
-
183
-
184
-
185
-
186
-
187
-
188
-
189
-
190
-
191
-
192
-
193
-
194
-
195
-
196
-
197
-
198
-
199
-
200
-
201
-
202
-
203
-
204
-
205
-
206
-
207
-
208
-
209
-
210
-
211
-
212
-
213
-
214
-
215
 |
 |

28
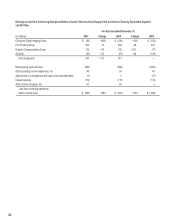
Loss From Continuing Operations Before Interest, Other Income (Charges), Net and Income Taxes
The loss from continuing operations before interest, other income (charges), net and income taxes for All Other was $50 million in the current year as
compared with a loss of $67 million in the year ended December 31, 2006. This $17 million improvement in earnings is largely driven by cost reduction
actions within the display business.
Results of Operations – Discontinued Operations
Total Company earnings from discontinued operations for the year ended December 31, 2007 and 2006 of $881 million and $203 million, respectively,
were net of provisions for income taxes of $262 million and $34 million, respectively.
Earnings from discontinued operations in 2007 were primarily driven by the $986 million pre-tax gain on the sale of the Health Group segment on April 30,
2007, and the $123 million pre-tax gain on the sale of Hermes Precisa Pty. Ltd. (“HPA”) on November 2, 2007. Also included in discontinued operations in
2007 are the results of operations of the Health Group segment and HPA through their respective dates of sale.
Earnings from discontinued operations in 2006 were primarily driven by results of operations of the Health Group segment.
For a detailed discussion of the components of discontinued operations, refer to Note 23, “Discontinued Operations,” in the Notes to Financial Statements.
Net Earnings
Consolidated net earnings for 2007 were $676 million, or earnings of $2.35 per basic and diluted share, as compared with a net loss for 2006 of $601
million, or a loss of $2.09 per basic and diluted share, representing an increase in earnings of $1,277 million or 212%. This improvement is attributable to
the reasons outlined above.
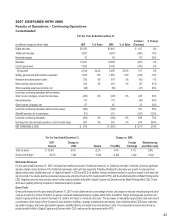
2006 COMPARED WITH 2005
Results of Operations - Continuing Operations
Consolidated
For the Year Ended December 31,
(in millions, except per share data)
2006
% of
Sales
2005
% of
Sales
Increase /
(Decrease)
% Change
Digital net sales $ 5,945 $ 5,561 $ 384 7%
Traditional net sales 4,574 5,777 (1,203) -21%
New technologies 49 57 (8) -14%
Net sales 10,568 11,395 (827) -7%
Cost of goods sold 8,159 8,864 (705) -8%
Gross profit 2,409 22.8% 2,531 22.2% (122) -5%
Selling, general and administrative expenses 1,950 18% 2,240 20% (290) -13%
Research and development costs 578 5% 739 6% (161) -22%
Restructuring costs and other 416 4% 665 6% (249) -37%
Other operating expenses (income), net (59) (40) (19) 48%
Loss from continuing operations before interest, other income
(charges), net and income taxes
(476)
-5%
(1,073)
-9%
597
56%
Interest expense 172 139 33 24%
Other income (charges), net 65 4 61 1,525%
Loss from continuing operations before income taxes (583) (1,208) 625 52%
Provision for income taxes 221 449 (228) -51%
Loss from continuing operations (804) -8% (1,657) -15% 853 51%
Earnings from discontinued operations, net of income taxes 203 2% 451 4% (248) -55%
Loss from cumulative effect of accounting change, net of
income taxes
—
(55)
—
NET LOSS $ (601) $ (1,261) $ 660 52%