Kodak 2007 Annual Report Download - page 163
Download and view the complete annual report
Please find page 163 of the 2007 Kodak annual report below. You can navigate through the pages in the report by either clicking on the pages listed below, or by using the keyword search tool below to find specific information within the annual report.-
 1
1 -
2
-
3
-
4
-
5
-
6
-
7
-
8
-
9
-
10
-
11
-
12
-
13
-
14
-
15
-
16
-
17
-
18
-
19
-
20
-
21
-
22
-
23
-
24
-
25
-
26
-
27
-
28
-
29
-
30
-
31
-
32
-
33
-
34
-
35
-
36
-
37
-
38
-
39
-
40
-
41
-
42
-
43
-
44
-
45
-
46
-
47
-
48
-
49
-
50
-
51
-
52
-
53
-
54
-
55
-
56
-
57
-
58
-
59
-
60
-
61
-
62
-
63
-
64
-
65
-
66
-
67
-
68
-
69
-
70
-
71
-
72
-
73
-
74
-
75
-
76
-
77
-
78
-
79
-
80
-
81
-
82
-
83
-
84
-
85
-
86
-
87
-
88
-
89
-
90
-
91
-
92
-
93
-
94
-
95
-
96
-
97
-
98
-
99
-
100
-
101
-
102
-
103
-
104
-
105
-
106
-
107
-
108
-
109
-
110
-
111
-
112
-
113
-
114
-
115
-
116
-
117
-
118
-
119
-
120
-
121
-
122
-
123
-
124
-
125
-
126
-
127
-
128
-
129
-
130
-
131
-
132
-
133
-
134
-
135
-
136
-
137
-
138
-
139
-
140
-
141
-
142
-
143
-
144
-
145
-
146
-
147
-
148
-
149
-
150
-
151
-
152
-
 153
153 -
 154
154 -
 155
155 -
 156
156 -
 157
157 -
 158
158 -
 159
159 -
 160
160 -
 161
161 -
 162
162 -
 163
163 -
 164
164 -
 165
165 -
 166
166 -
 167
167 -
 168
168 -
 169
169 -
 170
170 -
 171
171 -
 172
172 -
 173
173 -
174
-
175
-
176
-
177
-
178
-
179
-
180
-
181
-
182
-
183
-
184
-
185
-
186
-
187
-
188
-
189
-
190
-
191
-
192
-
193
-
194
-
195
-
196
-
197
-
198
-
199
-
200
-
201
-
202
-
203
-
204
-
205
-
206
-
207
-
208
-
209
-
210
-
211
-
212
-
213
-
214
-
215
 |
 |

40
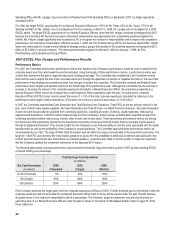
The 2007 market review indicated that: 1) base salaries of our Named Executive Officers are generally competitive; 2) target cash
compensation for our Named Executive Officers is aligned with or slightly above the approximate median value; and 3) total direct
compensation approximates the median for all Named Executive Officers. As noted above, the Committee does not target each element
of total direct compensation to the market median. However, in 2007 the Committee considered the results of the 2007 market review
when determining the appropriate level of each component of total direct compensation for the Named Executive Officers. The
compensation decisions specific to each component of total direct compensation for the Named Executive Officers are discussed under
“Elements of Total Direct Compensation,” beginning on page 40 of this Proxy Statement.
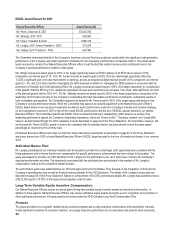
Use of Tally Sheets
In addition to the competitive benchmarking analysis, the Committee annually reviews all components of our Named Executive Officers’
compensation as presented in a comprehensive set of Tally Sheets prepared by the Committee’s independent compensation consultant.
The Tally Sheets provide a comprehensive view of each Named Executive Officer’s compensation, broken down into three components:
1)
An estimate of projected annual compensation, including total target cash compensation, the total estimated value of annual long-
term equity incentive awards and the value of benefits and perquisites received by each Named Executive Officer;
2) A comprehensive summary of the vested and unvested values of all outstanding equity awards held by each Named Executive
Officer at current and assumed future stock prices; and
3) A summary of the severance benefits potentially payable to each Named Executive Officer as of year end under various leaving
scenarios.
The Tally Sheets provide the Committee with context for the decisions they make in relation to total direct compensation. Although they do
not necessarily drive decision making with regard to specific components of the total compensation program, the Tally Sheets enable the
Committee to holistically assess total direct compensation and the relationship of various components of the total compensation program
to each other. The Tally Sheets also enable the Committee to determine how much wealth creation opportunity exists through equity-
based compensation and how strong the retention power is as a result of unvested value. The Tally Sheets may also influence the
Committee’s views on a variety of issues, such as changes to severance plans and employment agreements, special equity grants to
promote retention, or changes in long-term variable equity incentives.
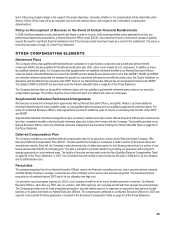
Use of the CEO Evaluation Process
The Presiding Director, the Chair of the Compensation Committee and the Chief Human Resources Officer lead the annual CEO
evaluation process to assess the performance of our CEO. In February each year, a written self-assessment of performance versus the
business plan of record is completed by our CEO. The written assessment is sent to the full Board for review. Later in the same month, the
Chief Human Resources Officer interviews each member of the Board to collect feedback against an established set of criteria, including
reaction to our CEO self-assessment and the Company’s leadership imperatives, which are “Drives to Win,” “Develops Leaders” and
“Leads With Values.” All input is summarized and reviewed by the Presiding Director and the Chair of the Compensation Committee, who
are responsible for delivering feedback to our CEO.
For 2007, the Committee determined that Mr. Perez had performed well with respect to execution as the Company had either already
completed, or was on track to achieve, each 2007 operational and strategic imperative of the Company. The Committee also determined
that Mr. Perez’s leadership had been outstanding based on a review of his leadership performance against each of the Company’s
leadership imperatives.
The Committee considered the evaluation results when determining our CEO’s annual variable cash incentive award for 2007 under
EXCEL, as further described on page 44 of this Proxy Statement. The results of the 2006 CEO evaluation were considered by the
Committee when determining our CEO’s long-term variable equity target allocation as described on page 46 of this Proxy Statement.
ELEMENTS OF TOTAL DIRECT COMPENSATION
Total direct compensation consists of the following elements: base salary, annual variable pay and long-term variable equity incentives.
Base Salaries
Base salaries are intended to provide a regular source of income to our Named Executive Officers. Consistent with our philosophy of tying
pay to performance, our Named Executive Officers receive a relatively small proportion of overall total direct compensation in the form of
base salary. The base salaries of our Named Executive Officers in 2007 ranged from approximately 14% to 28% of their total target direct
compensation, with a positive correlation between the degree of compensation at risk and the level of an executive’s responsibility.
Base salaries are reviewed annually by the Committee at the beginning of the year, but are not automatically increased annually. Rather,
base salaries are adjusted as the Committee deems appropriate to recognize expanded responsibilities, experience, the importance of the