Kodak 2007 Annual Report Download - page 166
Download and view the complete annual report
Please find page 166 of the 2007 Kodak annual report below. You can navigate through the pages in the report by either clicking on the pages listed below, or by using the keyword search tool below to find specific information within the annual report.-
 1
1 -
2
-
3
-
4
-
5
-
6
-
7
-
8
-
9
-
10
-
11
-
12
-
13
-
14
-
15
-
16
-
17
-
18
-
19
-
20
-
21
-
22
-
23
-
24
-
25
-
26
-
27
-
28
-
29
-
30
-
31
-
32
-
33
-
34
-
35
-
36
-
37
-
38
-
39
-
40
-
41
-
42
-
43
-
44
-
45
-
46
-
47
-
48
-
49
-
50
-
51
-
52
-
53
-
54
-
55
-
56
-
57
-
58
-
59
-
60
-
61
-
62
-
63
-
64
-
65
-
66
-
67
-
68
-
69
-
70
-
71
-
72
-
73
-
74
-
75
-
76
-
77
-
78
-
79
-
80
-
81
-
82
-
83
-
84
-
85
-
86
-
87
-
88
-
89
-
90
-
91
-
92
-
93
-
94
-
95
-
96
-
97
-
98
-
99
-
100
-
101
-
102
-
103
-
104
-
105
-
106
-
107
-
108
-
109
-
110
-
111
-
112
-
113
-
114
-
115
-
116
-
117
-
118
-
119
-
120
-
121
-
122
-
123
-
124
-
125
-
126
-
127
-
128
-
129
-
130
-
131
-
132
-
133
-
134
-
135
-
136
-
137
-
138
-
139
-
140
-
141
-
142
-
143
-
144
-
145
-
146
-
147
-
148
-
149
-
150
-
151
-
152
-
153
-
154
-
155
-
 156
156 -
 157
157 -
 158
158 -
 159
159 -
 160
160 -
 161
161 -
 162
162 -
 163
163 -
 164
164 -
 165
165 -
 166
166 -
 167
167 -
 168
168 -
 169
169 -
 170
170 -
 171
171 -
 172
172 -
 173
173 -
 174
174 -
 175
175 -
 176
176 -
177
-
178
-
179
-
180
-
181
-
182
-
183
-
184
-
185
-
186
-
187
-
188
-
189
-
190
-
191
-
192
-
193
-
194
-
195
-
196
-
197
-
198
-
199
-
200
-
201
-
202
-
203
-
204
-
205
-
206
-
207
-
208
-
209
-
210
-
211
-
212
-
213
-
214
-
215
 |
 |
43
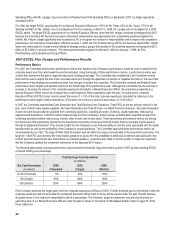
After determining the funding percentage derived from the performance matrix, the Committee reviews a set of baseline metrics to
determine the corporate award pool and the amount of such pool allocated to the Named Executive Officers. These baseline performance
metrics reflect key strategic or operational imperatives for the year associated with the Company’s business strategy. The baseline metrics
are “leading indicators” of the Company’s future success and are selected in part to ensure that the primary EXCEL performance metrics
are not achieved at the expense of other key goals that are critical to the Company’s ongoing success. The baseline metrics are also
designed to provide the Committee with additional performance metrics to guide their exercise of discretion in deciding whether to adjust
upward or downward the size of the corporate award pool and the amount allocated to each Named Executive Officer. Typically, the
baseline metrics are not assigned any relative weight vis-à-vis each other.
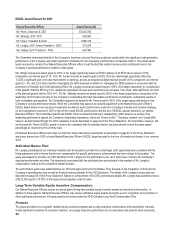
The baseline metrics established by the Committee for 2007 were:
• SG&A Reductions. The target SG&A (Selling, General & Administrative Expenses) reduction for 2007 was $100 million to
$150 million.
• Working Capital. The target for working capital was a reduction of $200 million.
• Complete 2007 Restructuring Plan. Performance to be assessed against significant milestones.
• Consumer Digital Imaging Group. Successful product launch.
• Film Products Group. Completion of the sale of our Light Management Film unit.
• Graphic Communications Group. Pass all milestones for successful launch of a Continuous Inkjet Production Press.
Determination of Corporate Award Pool
The EXCEL corporate award pool percentage determined by the Committee was 195% of target. This award pool funding percentage
corresponds to the Company’s Total EFO result of $343 million (inclusive of the EXCEL award accrual) and a Net Cash Generation result
of $333 million.
In coming to this determination, the Committee first considered the funding percentage derived from the performance matrix based on the
Company’s results against the two primary metrics. In 2007, the Company exceeded our Total EFO target and significantly exceeded our
Net Cash Generation target level, reflective of the Company’s successful implementation of its transformation strategy. The initial
performance funding percentage from the performance metric table based on these results was 221% reflecting a Net Cash Generation
result of $333 million and a Total EFO result (inclusive of a 221% EXCEL accrual) of $296 million. Next, the Committee reviewed the
Company’s results with respect to the baseline metrics. The Company exceeded the SG&A Reduction target and far exceeded the
Working Capital target. Additionally, the Company completed its 2007 restructuring plans, sold its Light Management Film business and
delivered all milestones to launch the Continuous Inkjet Production Press at Drupa in 2008. The Company had a slight delay to the CDG
product launch.
The Committee concluded that these positive baseline metric results supported funding the corporate award pool at a level significantly
above target. Based on management’s recommendations, however, the Committee exercised negative discretion to decrease the size of
the corporate award pool from 221% to the 195% referenced above, to reflect the impact on the performance metrics from the one-time
sale of an investment in 2007.
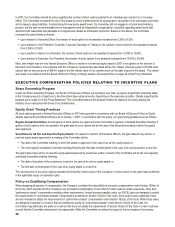
Committee Decision and Analysis
After determining the corporate award pool funding percentage, the Committee approved the actual EXCEL award percentage for each
Named Executive Officer, which were below the maximum amount permitted under EXCEL for each Named Executive Officer.
Our Named Executive Officers’ EXCEL awards are generally based on the achievement of the Company’s two primary performance
metrics and baseline metrics. The award may also, however, be determined based in part on the achievement of unit goals, where
applicable, and upon achievement of individual leadership excellence and diversity goals. Our CEO’s recommendations are based upon
his review of the individual performance of each executive and the business unit or staff function that they lead. As part of his review, our
CEO determines a funding percentage to be allocated to each business unit and staff function based upon the goals established for each
unit at the beginning of the year and based upon comparisons to prior year results. A Named Executive Officer heading a business unit or
function typically receives the same EXCEL award percentage that has been allocated to his or her business unit or function, although
positive adjustments may be made based on an executive’s leadership excellence and/or performance under the Company’s diversity and
inclusion strategy. In 2007, the CEO allocated GCG a funding percentage equal to 185%. CDG was allocated a funding percentage equal
to 205%. FPG was allocated a funding percentage equal to 210%, and the Company’s Finance function was allocated a funding
percentage equal to 200%.
Using these CEO’s recommendations, the Committee reviewed and authorized bonuses for each of our Named Executive Officers as
indicated in the following table and presented in greater detail in the Summary Compensation Table on page 51 of this Proxy Statement.