Kodak 2007 Annual Report Download - page 30
Download and view the complete annual report
Please find page 30 of the 2007 Kodak annual report below. You can navigate through the pages in the report by either clicking on the pages listed below, or by using the keyword search tool below to find specific information within the annual report.-
 1
1 -
2
-
3
-
4
-
5
-
6
-
7
-
8
-
9
-
10
-
11
-
12
-
13
-
14
-
15
-
16
-
17
-
18
-
19
-
 20
20 -
 21
21 -
 22
22 -
 23
23 -
 24
24 -
 25
25 -
 26
26 -
 27
27 -
 28
28 -
 29
29 -
 30
30 -
 31
31 -
 32
32 -
 33
33 -
 34
34 -
 35
35 -
 36
36 -
 37
37 -
 38
38 -
 39
39 -
 40
40 -
41
-
42
-
43
-
44
-
45
-
46
-
47
-
48
-
49
-
50
-
51
-
52
-
53
-
54
-
55
-
56
-
57
-
58
-
59
-
60
-
61
-
62
-
63
-
64
-
65
-
66
-
67
-
68
-
69
-
70
-
71
-
72
-
73
-
74
-
75
-
76
-
77
-
78
-
79
-
80
-
81
-
82
-
83
-
84
-
85
-
86
-
87
-
88
-
89
-
90
-
91
-
92
-
93
-
94
-
95
-
96
-
97
-
98
-
99
-
100
-
101
-
102
-
103
-
104
-
105
-
106
-
107
-
108
-
109
-
110
-
111
-
112
-
113
-
114
-
115
-
116
-
117
-
118
-
119
-
120
-
121
-
122
-
123
-
124
-
125
-
126
-
127
-
128
-
129
-
130
-
131
-
132
-
133
-
134
-
135
-
136
-
137
-
138
-
139
-
140
-
141
-
142
-
143
-
144
-
145
-
146
-
147
-
148
-
149
-
150
-
151
-
152
-
153
-
154
-
155
-
156
-
157
-
158
-
159
-
160
-
161
-
162
-
163
-
164
-
165
-
166
-
167
-
168
-
169
-
170
-
171
-
172
-
173
-
174
-
175
-
176
-
177
-
178
-
179
-
180
-
181
-
182
-
183
-
184
-
185
-
186
-
187
-
188
-
189
-
190
-
191
-
192
-
193
-
194
-
195
-
196
-
197
-
198
-
199
-
200
-
201
-
202
-
203
-
204
-
205
-
206
-
207
-
208
-
209
-
210
-
211
-
212
-
213
-
214
-
215
 |
 |

29
For the Year Ended December 31, Change vs. 2005
2006
Amount
Change vs.
2005
Volume
Price/Mix
Foreign
Exchange
Manufacturing
and Other Costs
Acquisitions
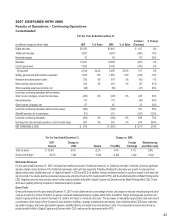
Total net sales $10,568 -7.3% -10.1% -3.3% 0.5% 0.0% 5.6%
Gross profit margin 22.8% 0.6pp 0.0pp 0.4pp 0.1pp -0.4pp 0.5pp
Worldwide Revenues
The decrease in net sales was primarily due to significant industry-related volume declines in the traditional businesses within all three segments, partially
offset by growth in digital revenues. The volume declines were primarily driven by Film Capture within FPG, and Digital Capture and Devices and the
traditional portion of Retail Printing within CDG. Negative price/mix was primarily driven by Prepress Solutions within GCG, Retail Printing and Digital
Capture and Devices within CDG, and Film Capture within FPG. These items were partially offset by an increase in digital revenue due to the KPG and
Creo acquisitions in the second quarter of 2005, intellectual property royalties, and favorable foreign exchange.
Gross Profit
Gross profit margin for 2006 increased as compared with 2005 due largely to the 2005 acquisitions of Kodak Polychrome Graphics (“KPG”) and Creo
Inc. (“Creo”), favorable price/mix in Digital Capture and Devices within CDG, including increased intellectual property royalties, and favorable foreign
exchange. These increases were partially offset by increased manufacturing and other costs.
Included in gross profit for the year are extensions and amendments of existing license arrangements and a new licensing arrangement. The non-recurring
portions of these licensing arrangements contributed approximately 1.7% of revenue to consolidated gross profit dollars in 2006, as compared with 0.5%
of revenue to consolidated gross profit dollars for similar arrangements in 2005.
Selling, General and Administrative Expenses
The year-over-year decrease in consolidated SG&A was primarily attributable to Company-wide cost reduction initiatives.
Research and Development Costs
The decrease in R&D costs was primarily driven by: (1) write-offs in 2005 of purchased in-process R&D of $54 million associated with acquisitions made
during 2005, (2) significant spending reductions related to traditional products and services, (3) lower R&D spending related to the display business, and
(4) integration synergies within the GCG segment.
Restructuring Costs and Other
These costs, as well as the restructuring-related costs reported in cost of goods sold, are discussed in further detail under “Restructuring Costs and Other”
below.
Other Operating (Income) Expenses, Net
The other operating (income) expenses, net category includes gains and losses on sales of capital assets and certain asset impairment charges. Other
operating income was $59 million for 2006 as compared with other operating income of $40 million for 2005, representing an improvement of $19 million.
This improvement was largely driven by lower asset impairments.
Interest Expense
Higher interest expense is primarily attributable to increased levels of debt associated with the 2005 acquisitions of KPG and Creo, and higher interest
rates.
Other Income (Charges), Net
The other income (charges), net component includes interest income, income and losses from equity investments, and foreign exchange gains and losses.
The increase in other income (charges), net was primarily attributable to: (1) a year-over-year increase in interest income of $35 million, (2) lower losses
on foreign exchange, which resulted in an increase in other income of $31 million, and (3) lower impairment charges on equity method investments, which
increased other income by $19 million. These increases were partially offset by a loss on the early extinguishment of debt in 2006 of $9 million.