Kodak 2007 Annual Report Download - page 27
Download and view the complete annual report
Please find page 27 of the 2007 Kodak annual report below. You can navigate through the pages in the report by either clicking on the pages listed below, or by using the keyword search tool below to find specific information within the annual report.-
 1
1 -
2
-
3
-
4
-
5
-
6
-
7
-
8
-
9
-
10
-
11
-
12
-
13
-
14
-
15
-
16
-
 17
17 -
 18
18 -
 19
19 -
 20
20 -
 21
21 -
 22
22 -
 23
23 -
 24
24 -
 25
25 -
 26
26 -
 27
27 -
 28
28 -
 29
29 -
 30
30 -
 31
31 -
 32
32 -
 33
33 -
 34
34 -
 35
35 -
 36
36 -
 37
37 -
38
-
39
-
40
-
41
-
42
-
43
-
44
-
45
-
46
-
47
-
48
-
49
-
50
-
51
-
52
-
53
-
54
-
55
-
56
-
57
-
58
-
59
-
60
-
61
-
62
-
63
-
64
-
65
-
66
-
67
-
68
-
69
-
70
-
71
-
72
-
73
-
74
-
75
-
76
-
77
-
78
-
79
-
80
-
81
-
82
-
83
-
84
-
85
-
86
-
87
-
88
-
89
-
90
-
91
-
92
-
93
-
94
-
95
-
96
-
97
-
98
-
99
-
100
-
101
-
102
-
103
-
104
-
105
-
106
-
107
-
108
-
109
-
110
-
111
-
112
-
113
-
114
-
115
-
116
-
117
-
118
-
119
-
120
-
121
-
122
-
123
-
124
-
125
-
126
-
127
-
128
-
129
-
130
-
131
-
132
-
133
-
134
-
135
-
136
-
137
-
138
-
139
-
140
-
141
-
142
-
143
-
144
-
145
-
146
-
147
-
148
-
149
-
150
-
151
-
152
-
153
-
154
-
155
-
156
-
157
-
158
-
159
-
160
-
161
-
162
-
163
-
164
-
165
-
166
-
167
-
168
-
169
-
170
-
171
-
172
-
173
-
174
-
175
-
176
-
177
-
178
-
179
-
180
-
181
-
182
-
183
-
184
-
185
-
186
-
187
-
188
-
189
-
190
-
191
-
192
-
193
-
194
-
195
-
196
-
197
-
198
-
199
-
200
-
201
-
202
-
203
-
204
-
205
-
206
-
207
-
208
-
209
-
210
-
211
-
212
-
213
-
214
-
215
 |
 |

26
Selling, General and Administrative Expenses
The decrease in SG&A expenses for CDG in dollars and as a percent of sales was primarily driven by focused cost reduction initiatives and improved go-
to-market structure, partially offset by increased advertising expenses associated with Consumer Inkjet Systems.
Research and Development Costs
The decrease in R&D costs for CDG is largely attributable to spending incurred in 2006 related to the development of Consumer Inkjet Systems, which
were introduced in the first quarter of 2007. The decrease was also impacted by cost reduction actions.
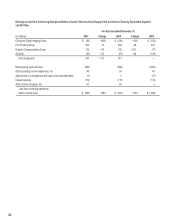
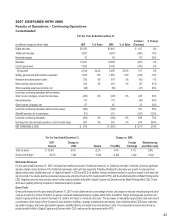
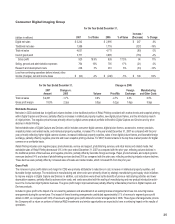
Film Products Group
For the Year Ended December 31,
(dollars in millions)
2007
% of
Sales
2006
% of
Sales
Increase /
(Decrease)
% Change
Total net sales $ 1,968 $ 2,312 $ (344) -15%
Cost of goods sold 1,242 1,460 (218) -15%
Gross profit 726 36.9% 852 36.9% (126) -15%
Selling, general and administrative expenses 328 17% 451 20% (123) -27%
Research and development costs 29 1% 33 1% (4) -12%
Earnings from continuing operations before interest, other
income (charges), net and income taxes
$ 369
19%
$ 368
16%
$ 1
0%
For the Year Ended December 31, Change vs. 2006
2007
Amount
Change vs.
2006
Volume
Price/Mix
Foreign
Exchange
Manufacturing
and Other Costs
Total net sales $ 1,968 -14.9% -14.0% -3.8% 2.9% 0.0%
Gross profit margin 36.9% 0.0pp 0.0pp -4.7pp 2.1pp 2.6pp
Worldwide Revenues
The decrease in FPG worldwide net sales was comprised of: (1) lower volumes, which were in line with industry trends, and (2) declines related to
negative price/mix associated with new and renewed film agreements and geographic mix. These decreases were partially offset by favorable foreign
exchange.
Net worldwide sales of Film Capture, including consumer roll film (35mm and APS film), one-time-use cameras (OTUC), professional films, and reloadable
film cameras, decreased 30% in 2007 as compared with the prior year, primarily reflecting continuing industry volume declines and negative price/mix,
partially offset by favorable exchange.
Net worldwide sales for Entertainment Imaging, which include origination, intermediate, and print films, and digital systems and services for the entertain-
ment industry, were flat as compared with the prior year.
Gross Profit
FPG gross profit margin was unchanged, despite the 15% decrease in net sales for the year. The decrease in gross profit dollars was primarily a result of
lower volumes in Film Capture, negative price/mix associated with new and renewed film agreements, partially offset by foreign exchange and reduced
manufacturing and other costs. The reduced manufacturing and other costs were driven by the manufacturing footprint reduction and other cost reduction
initiatives, partially offset by higher silver costs.
Selling, General and Administrative Expenses
The decline in SG&A expenses for FPG in dollars and as a percent of sales was attributable to the concentrated efforts of the business to reduce costs
and shifting to a distributor model in regions with lower sales volumes.