Kodak 2007 Annual Report Download - page 165
Download and view the complete annual report
Please find page 165 of the 2007 Kodak annual report below. You can navigate through the pages in the report by either clicking on the pages listed below, or by using the keyword search tool below to find specific information within the annual report.-
 1
1 -
2
-
3
-
4
-
5
-
6
-
7
-
8
-
9
-
10
-
11
-
12
-
13
-
14
-
15
-
16
-
17
-
18
-
19
-
20
-
21
-
22
-
23
-
24
-
25
-
26
-
27
-
28
-
29
-
30
-
31
-
32
-
33
-
34
-
35
-
36
-
37
-
38
-
39
-
40
-
41
-
42
-
43
-
44
-
45
-
46
-
47
-
48
-
49
-
50
-
51
-
52
-
53
-
54
-
55
-
56
-
57
-
58
-
59
-
60
-
61
-
62
-
63
-
64
-
65
-
66
-
67
-
68
-
69
-
70
-
71
-
72
-
73
-
74
-
75
-
76
-
77
-
78
-
79
-
80
-
81
-
82
-
83
-
84
-
85
-
86
-
87
-
88
-
89
-
90
-
91
-
92
-
93
-
94
-
95
-
96
-
97
-
98
-
99
-
100
-
101
-
102
-
103
-
104
-
105
-
106
-
107
-
108
-
109
-
110
-
111
-
112
-
113
-
114
-
115
-
116
-
117
-
118
-
119
-
120
-
121
-
122
-
123
-
124
-
125
-
126
-
127
-
128
-
129
-
130
-
131
-
132
-
133
-
134
-
135
-
136
-
137
-
138
-
139
-
140
-
141
-
142
-
143
-
144
-
145
-
146
-
147
-
148
-
149
-
150
-
151
-
152
-
153
-
154
-
 155
155 -
 156
156 -
 157
157 -
 158
158 -
 159
159 -
 160
160 -
 161
161 -
 162
162 -
 163
163 -
 164
164 -
 165
165 -
 166
166 -
 167
167 -
 168
168 -
 169
169 -
 170
170 -
 171
171 -
 172
172 -
 173
173 -
 174
174 -
 175
175 -
176
-
177
-
178
-
179
-
180
-
181
-
182
-
183
-
184
-
185
-
186
-
187
-
188
-
189
-
190
-
191
-
192
-
193
-
194
-
195
-
196
-
197
-
198
-
199
-
200
-
201
-
202
-
203
-
204
-
205
-
206
-
207
-
208
-
209
-
210
-
211
-
212
-
213
-
214
-
215
 |
 |

42
Operating Office with Mr. Langley. Upon promotion to President and Chief Operating Officer in September 2007, his target opportunity
increased to 85%.
For 2008, the target EXCEL opportunities for our Named Executive Officers are: 155% for Mr. Perez, 85% for Mr. Faraci, 75% for Mr.
Sklarsky and 65% for Ms. Hellyar. Due to his departure from the company on March 14, 2008, Mr. Langley will not be eligible for a 2008
EXCEL award. The target EXCEL opportunity for our Named Executive Officers, other than Ms. Hellyar, remained unchanged from 2007
because the Committee felt that each executive’s total direct compensation was appropriate and competitively positioned against the
market. Ms. Hellyar’s target opportunity was increased by 3% to recognize her increase in responsibilities and to improve the competitive
positioning of her total direct compensation. Effective January 1, 2008, the Film Products Group (FPG), the business segment Ms. Hellyar
leads, was restructured to include several additional strategic product groups that resulted in this business segment increasing from $2.5
billion to $3.5 billion in annual revenues. The restructured business segment is referred to, effective January 1, 2008, as Film,
Photofinishing, and Entertainment Group (FPEG).
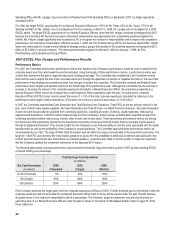
2007 EXCEL Plan Design and Performance Results
Performance Metrics
For 2007, the Committee selected two performance metrics that, based on the Company’s performance, would be used to determine the
corporate award pool from which awards would be allocated. Using the targets of these performance metrics, a performance matrix was
created that determined the plan’s corporate award pool funding percentage. The Committee also established a set of baseline metrics
that could be used to adjust the size of the corporate award pool through the application of positive or negative discretion in the event that
performance in key strategic and operational areas was stronger or weaker than expected. The Committee reviewed and finalized these
performance metric targets and baseline metrics in the first 90 days of the performance year. Although the Committee has the authority to
increase or decrease the amount of the corporate award pool allocated to a Named Executive Officer, the actual bonus awarded to a
Named Executive Officer cannot be increased beyond the maximum limits established under the plan. As noted above, a Named
Executive Officer’s EXCEL bonus cannot exceed the lesser of: i) 10% of the total corporate award pool calculated by reference to the
performance metric targets (without discretion); ii) five times his or her prior year-end base salary; or iii) $5 million.
In 2007 the Committee selected Net Cash Generation and Total Earnings from Operations (Total EFO) as the two primary metrics for the
plan, each of which were equally weighted. Net Cash Generation and Total EFO are non-GAAP financial measures. Net Cash Generation
means net cash flow provided by activities from continuing operations, including proceeds, dividends, capital expenses, restructuring
payments and divestitures. Total EFO means total earnings of all the Company’s product groups included within segment earnings from
continuing operations before restructuring, interest, other income and income taxes. These two primary performance metrics are among
the metrics our CEO periodically reported to the investment community and are key financial metrics that the Company has focused on
through its digital transformation. They provide insight into the Company’s cash flow and ability to fund the costs associated with the digital
transformation as well as the profitability of the Company’s overall operations. The Committee approved these performance metrics as
recommended by our CEO. The target for Net Cash Generation was set within the range communicated to the investment community. The
target for Total EFO was set below the initial market guidance to account for the probability of additional investment associated with new
product launches beyond what was factored into our external guidance. A decision was made in the first quarter to make the investment,
and the Company updated the investment community on the expected EFO impact.
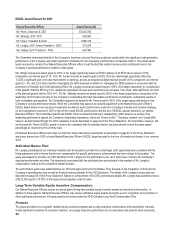
The following abbreviated corporate performance matrix shows the threshold, target and stretch goals for 2007 and the resulting EXCEL
corporate funding pool percentage:
Total Earnings From Operations
(in millions)
Net Cash Generation
(in millions)
$200
(Threshold)
$235
(Target)
$400
(Stretch)
$-100 (Threshold) 0% 40% 130%
100 (Target) 60% 100% 190%
300 (Stretch) 120% 160% 250%
If the Company achieves the target goals, then the corporate award pool will fund at 100%. If either threshold goal is not achieved, then the
corporate award pool will not be funded for our Named Executive Officers and no bonus will be earned under the plan. Results between
the goals shown in the matrix are interpolated to derive a percentage. The threshold, target and maximum annual bonus that may be
earned by each of our Named Executive Officers under the plan is shown in the Grants of Plan-Based Awards Table on page 57 of this
Proxy Statement.