Kodak 2007 Annual Report Download - page 34
Download and view the complete annual report
Please find page 34 of the 2007 Kodak annual report below. You can navigate through the pages in the report by either clicking on the pages listed below, or by using the keyword search tool below to find specific information within the annual report.-
 1
1 -
2
-
3
-
4
-
5
-
6
-
7
-
8
-
9
-
10
-
11
-
12
-
13
-
14
-
15
-
16
-
17
-
18
-
19
-
20
-
21
-
22
-
23
-
 24
24 -
 25
25 -
 26
26 -
 27
27 -
 28
28 -
 29
29 -
 30
30 -
 31
31 -
 32
32 -
 33
33 -
 34
34 -
 35
35 -
 36
36 -
 37
37 -
 38
38 -
 39
39 -
 40
40 -
 41
41 -
 42
42 -
 43
43 -
 44
44 -
45
-
46
-
47
-
48
-
49
-
50
-
51
-
52
-
53
-
54
-
55
-
56
-
57
-
58
-
59
-
60
-
61
-
62
-
63
-
64
-
65
-
66
-
67
-
68
-
69
-
70
-
71
-
72
-
73
-
74
-
75
-
76
-
77
-
78
-
79
-
80
-
81
-
82
-
83
-
84
-
85
-
86
-
87
-
88
-
89
-
90
-
91
-
92
-
93
-
94
-
95
-
96
-
97
-
98
-
99
-
100
-
101
-
102
-
103
-
104
-
105
-
106
-
107
-
108
-
109
-
110
-
111
-
112
-
113
-
114
-
115
-
116
-
117
-
118
-
119
-
120
-
121
-
122
-
123
-
124
-
125
-
126
-
127
-
128
-
129
-
130
-
131
-
132
-
133
-
134
-
135
-
136
-
137
-
138
-
139
-
140
-
141
-
142
-
143
-
144
-
145
-
146
-
147
-
148
-
149
-
150
-
151
-
152
-
153
-
154
-
155
-
156
-
157
-
158
-
159
-
160
-
161
-
162
-
163
-
164
-
165
-
166
-
167
-
168
-
169
-
170
-
171
-
172
-
173
-
174
-
175
-
176
-
177
-
178
-
179
-
180
-
181
-
182
-
183
-
184
-
185
-
186
-
187
-
188
-
189
-
190
-
191
-
192
-
193
-
194
-
195
-
196
-
197
-
198
-
199
-
200
-
201
-
202
-
203
-
204
-
205
-
206
-
207
-
208
-
209
-
210
-
211
-
212
-
213
-
214
-
215
 |
 |
33
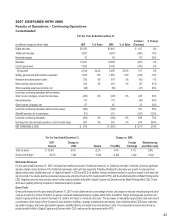
Research and Development Costs
The decrease in R&D costs was primarily driven by $52 million of write-offs in 2005 for purchased in-process R&D associated with acquisitions, and was
also driven by integration synergies.
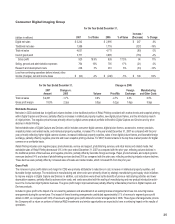
All Other
Worldwide Revenues
Net worldwide sales for All Other were $68 million for 2006 as compared with $83 million for 2005, representing a decrease of $15 million, or 18%. Net
sales in the U.S. were $50 million for 2006 as compared with $47 million for the prior year, representing an increase of $3 million, or 6%. Net sales outside
the U.S. were $18 million in 2006 as compared with $36 million in the prior year, representing a decrease of $18 million, or 50%.
Loss From Continuing Operations Before Interest, Other Income (Charges), Net and Income Taxes
The loss from continuing operations before interest, other income (charges), net and income taxes for All Other was $67 million in 2006 as compared with
a loss of $128 million in 2005. This improvement in earnings was primarily driven by overall SG&A cost reductions of $37 million, and reductions in R&D
spending for the display business of $31 million.
Earnings from Discontinued Operations, Net of Income Taxes
Earnings from discontinued operations for 2006 were $203 million, as compared with earnings from discontinued operations for 2005 of $451 million.
Earnings from discontinued operations in 2006 were primarily driven by results of operations of the Health Group segment and also include the operations
of HPA. (See Note 23, “Discontinued Operations” in the Notes to Financial Statements.)
The 2005 earnings from discontinued operations were primarily driven by results of operations of the Health Group segment, and by a $203 million
reversal of certain tax accruals as a result of a settlement between the Company and the Internal Revenue Service on the audit of the tax years 1993
through 1998. These accruals had been established in 1994 in connection with the Company’s sale of its pharmaceutical, consumer health and household
products businesses during that year. These items were partially offset by a pension settlement charge of $54 million resulting from the finalization of the
transfer of pension assets to ITT Industries, Inc. (ITT) in connection with the sale of the Company’s Remote Sensing Systems business (RSS) in August
2004.
Loss from Cumulative Effect of Accounting Change, Net of Income Taxes
There was no loss from cumulative effect of accounting change, net of income taxes for 2006. The loss from cumulative effect of an accounting change,
net of income taxes, of $55 million or $.19 per basic and diluted share for 2005 was the result of the Company’s adoption of FASB Interpretation No. (FIN)
47, “Accounting for Conditional Asset Retirement Obligations,” as of December 31, 2005. Under FIN 47, the Company is required to record an obligation
and an asset for the present value of the estimated cost of fulfilling its legal obligation with respect to the retirement of an asset when the timing or method
of settling that obligation is conditional upon a future event (for example, the sale of, exiting from or disposal of an asset - the “settlement date”). The pri-
mary application of FIN 47 to the Company is with respect to asbestos remediation. The $55 million charge represents the present value of the Company’s
asset retirement obligations (net of the related unamortized asset) relating to facilities with estimated settlement dates. Refer to further discussion in the
“Recently Issued Accounting Standards” section within Note 1 in the Notes to Financial Statements.
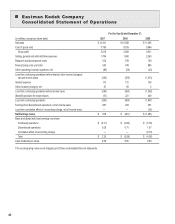
Net Loss
The consolidated net loss for 2006 was $601 million, or a loss of $2.09 per basic and diluted share, as compared with a net loss for 2005 of $1,261 million,
or a loss of $4.38 per basic and diluted share, representing an increase in earnings of $660 million or 52%. This improvement is attributable to the reasons
outlined above.
Restructuring Costs and Other
The Company has undertaken a cost reduction program that was initially announced in January 2004. This program has been referred to as the “2004–
2007 Restructuring Program.” This program was initially expected to result in total charges of $1.3 billion to $1.7 billion over a three-year period ending
in 2006. Overall, Kodak’s worldwide facility square footage was expected to be reduced by approximately one-third, and approximately 12,000 to 15,000
positions worldwide were expected to be eliminated, primarily in global manufacturing, selected traditional businesses, and corporate administration.
As the 2004-2007 Restructuring Program underpinned a dramatic transformation of the Company, the underlying business model necessarily evolved.
This required broader and more costly manufacturing infrastructure reductions (primarily non-cash charges) than originally anticipated, as well as similarly
broader rationalization of selling, administrative and other business resources (primarily severance charges). As a result, the Company expanded the
program to extend into 2007 and increased the expected employment reductions to 28,000 to 30,000 positions and total charges to $3.6 billion to $3.8
billion. In addition, the divestiture of the Health Group in the second quarter of 2007 further increased the amount of reductions necessary to appropriately
scale the corporate infrastructure.