Kodak 2007 Annual Report Download - page 95
Download and view the complete annual report
Please find page 95 of the 2007 Kodak annual report below. You can navigate through the pages in the report by either clicking on the pages listed below, or by using the keyword search tool below to find specific information within the annual report.-
 1
1 -
2
-
3
-
4
-
5
-
6
-
7
-
8
-
9
-
10
-
11
-
12
-
13
-
14
-
15
-
16
-
17
-
18
-
19
-
20
-
21
-
22
-
23
-
24
-
25
-
26
-
27
-
28
-
29
-
30
-
31
-
32
-
33
-
34
-
35
-
36
-
37
-
38
-
39
-
40
-
41
-
42
-
43
-
44
-
45
-
46
-
47
-
48
-
49
-
50
-
51
-
52
-
53
-
54
-
55
-
56
-
57
-
58
-
59
-
60
-
61
-
62
-
63
-
64
-
65
-
66
-
67
-
68
-
69
-
70
-
71
-
72
-
73
-
74
-
75
-
76
-
77
-
78
-
79
-
80
-
81
-
82
-
83
-
84
-
 85
85 -
 86
86 -
 87
87 -
 88
88 -
 89
89 -
 90
90 -
 91
91 -
 92
92 -
 93
93 -
 94
94 -
 95
95 -
 96
96 -
 97
97 -
 98
98 -
 99
99 -
 100
100 -
 101
101 -
 102
102 -
 103
103 -
 104
104 -
 105
105 -
106
-
107
-
108
-
109
-
110
-
111
-
112
-
113
-
114
-
115
-
116
-
117
-
118
-
119
-
120
-
121
-
122
-
123
-
124
-
125
-
126
-
127
-
128
-
129
-
130
-
131
-
132
-
133
-
134
-
135
-
136
-
137
-
138
-
139
-
140
-
141
-
142
-
143
-
144
-
145
-
146
-
147
-
148
-
149
-
150
-
151
-
152
-
153
-
154
-
155
-
156
-
157
-
158
-
159
-
160
-
161
-
162
-
163
-
164
-
165
-
166
-
167
-
168
-
169
-
170
-
171
-
172
-
173
-
174
-
175
-
176
-
177
-
178
-
179
-
180
-
181
-
182
-
183
-
184
-
185
-
186
-
187
-
188
-
189
-
190
-
191
-
192
-
193
-
194
-
195
-
196
-
197
-
198
-
199
-
200
-
201
-
202
-
203
-
204
-
205
-
206
-
207
-
208
-
209
-
210
-
211
-
212
-
213
-
214
-
215
 |
 |

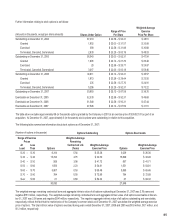
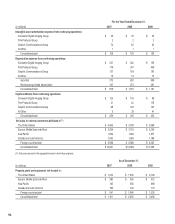
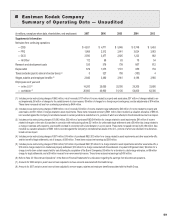
94
For the Year Ended December 31,
(in millions) 2007 2006 2005
Intangible asset amortization expense from continuing operations:
Consumer Digital Imaging Group $ 29 $ 35 $ 35
Film Products Group 2 2 2
Graphic Communications Group 74 82 62
All Other 1 1 1
Consolidated total $ 106 $ 120 $ 100
Depreciation expense from continuing operations:
Consumer Digital Imaging Group $ 237 $ 282 $ 159
Film Products Group 179 347 459
Graphic Communications Group 137 159 167
All Other 19 14 15
Sub-total 572 802 800
Restructuring-related depreciation 107 273 391
Consolidated total $ 679 $ 1,075 $ 1,191
Capital additions from continuing operations:
Consumer Digital Imaging Group $ 125 $ 116 $ 88
Film Products Group 31 42 176
Graphic Communications Group 98 142 127
All Other 5 35 41
Consolidated total $ 259 $ 335 $ 432
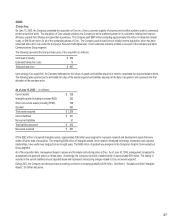
Net sales to external customers attributed to
(1):
The United States $ 4,403 $ 4,700 $ 5,090
Europe, Middle East and Africa $ 3,264 $ 3,118 $ 3,259
Asia Pacific 1,592 1,694 1,877
Canada and Latin America 1,042 1,056 1,169
Foreign countries total $ 5,898 $ 5,868 $ 6,305
Consolidated total $ 10,301 $ 10,568 $ 11,395
(1) Sales are reported in the geographic area in which they originate.
As of December 31,
(in millions) 2007 2006 2005
Property, plant and equipment, net located in :
The United States $ 1,270 $ 1,553 $ 2,125
Europe, Middle East and Africa $ 290 $ 355 $ 512
Asia Pacific 145 554 668
Canada and Latin America 106 140 175
Foreign countries total $ 541 $ 1,049 $ 1,355
Consolidated total $ 1,811 $ 2,602 $ 3,480